Personal Wealth Management / Economics
The Trouble With Long-Term Budget Projections
Despite the popular interpretations of the CBO’s latest forecasts, America isn’t staring down a debt crisis.


The US Treasury building soaking in a sunny day (and your tax dollars). Photo by steinphoto/iStock by Getty Images.
After the CBO released its latest exercise in straight-line math yesterday, projecting $1 trillion annual federal budget deficits two years ahead of schedule, we have seen a rash of debt-related fears—most centering on the risk to the US economy when interest rates rise. We think “if” is more reasonable than “when,” in that prior sentence, as interest rates aren’t certain to soar, but such nuance is often lost in fearful headlines. Particularly when the CBO pencils in average interest rates on US debt rising from 2.0% last year to 3.4% by 2028. That, according to the forecast, would send interest payments from 8% of total federal revenues last year to 16% in 2022 and beyond. Now, we don’t think endlessly piling on debt is a fantastic idea. But we think investors should keep a cool head when it comes to these budget forecasts.
Even if the CBO ends up correct, this isn’t necessarily problematic. One, markets tend to discount widely discussed events, and CBO forecasts don’t exactly fly under the radar. The surprise potential here is tiny. Moreover, markets usually move on expected events about 3 – 30 months ahead—a 10-year forecast is far outside that, which is largely immaterial to stocks today. It isn’t even clear any of this would be inherently bad for stocks. As Exhibit 1 shows, interest payments spent most of the late-1980s and early to mid-1990s near or above 16% of tax revenues. The economy didn’t implode. Neither did stocks, which enjoyed some big booms.
Exhibit 1: Past, Present and Imaginary Future Interest Payments as a Percentage of Tax Revenues
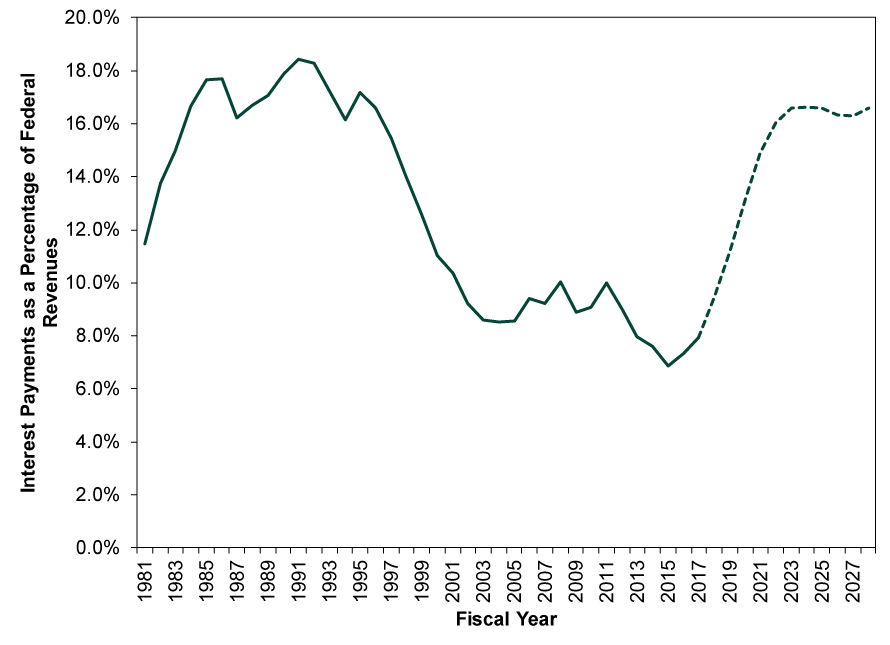
Source: Federal Reserve Bank of St. Louis and Congressional Budget Office, as of 4/10/2018. Annual figures for 1981 – 2017 represent actual results. 2018 – 2028 projections based on the CBO’s April 2018 10-Year Budget Projections.
But—and not to be mean—the preceding paragraph and chart probably give the CBO too much credit. They do the best they can, but their projections rely on straight-line math and a host of other assumptions, like future interest rates, tax revenues, economic growth and many others. Reality isn’t anywhere near this simple. Interest payments won’t just depend on future deficits and interest rates. They will also depend on how future interest rates compare to the interest rates on all maturing debt during the next decade. For instance: The Treasury is scheduled to refinance about $35 billion in maturing 10-year bonds next month. The two tranches had yields of 3.9% and 4.2% at issue. 10-year yields may have risen over the past several months, but at 2.8%, they are cheaper than when these bonds were issued.[i] Hence, presuming yields don’t soar by May 15, the interest payments on this debt will fall, not rise.
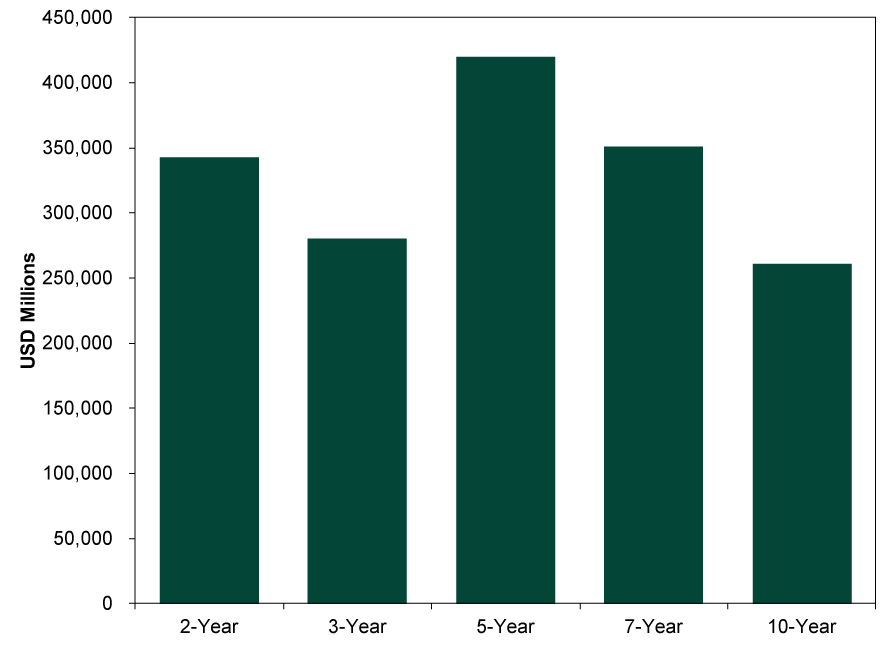
Uncle Sam has about $3.6 trillion worth of debt to refinance over the rest of this year.[ii] As Exhibit 2 shows, the Treasury Note component of this is scattered across five maturities (for simplicity, we excluded short-term Treasury Bills). As Exhibit 3 shows, the impact on interest payments will depend on volatility in interest rates across all maturities over the balance of the year. The same goes for 2019, when $2.1 trillion in US debt matures, as shown in Exhibits 4 and 5.[iii] Oh, and even if you can perfectly forecast all these interest rates at these specific times, it is impossible to know how the Treasury will refinance this debt. What if they decide to lengthen or shorten average maturity? That changes the calculus a lot, and it is not a market function. You can’t handicap it.
Exhibit 2: Total Treasury Bonds Maturing in the Rest of 2018
Source: US Treasury, as of 4/10/2018.
Exhibit 3: US Treasury Bonds Maturing in the Rest of 2018, by Month and Maturity
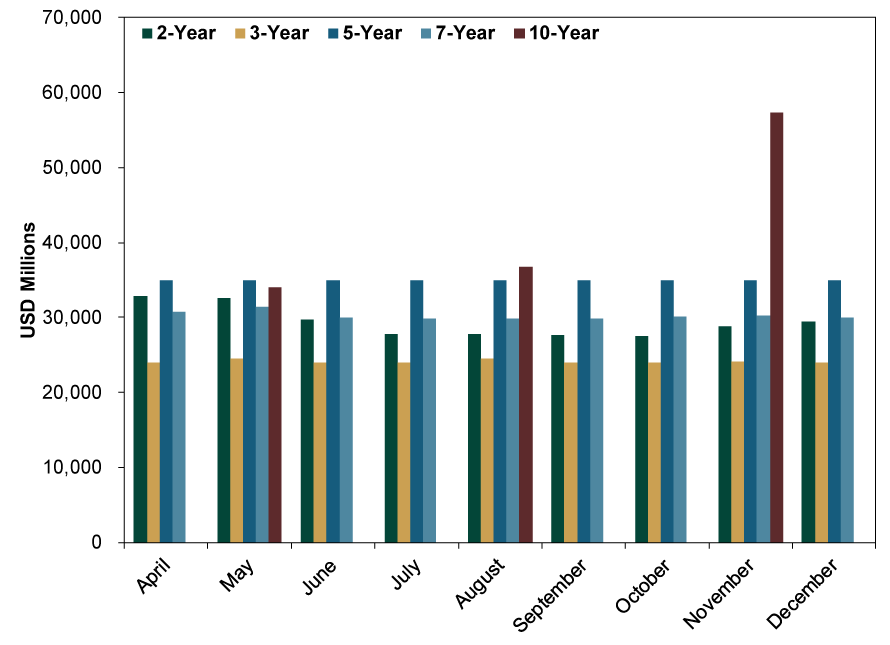
Source: US Treasury, as of 4/10/2018.
Exhibit 4: Total Treasury Bonds Maturing in 2019
Source: US Treasury, as of 4/10/2018.
Exhibit 5: US Treasury Bonds Maturing in 2019, by Month and Maturity
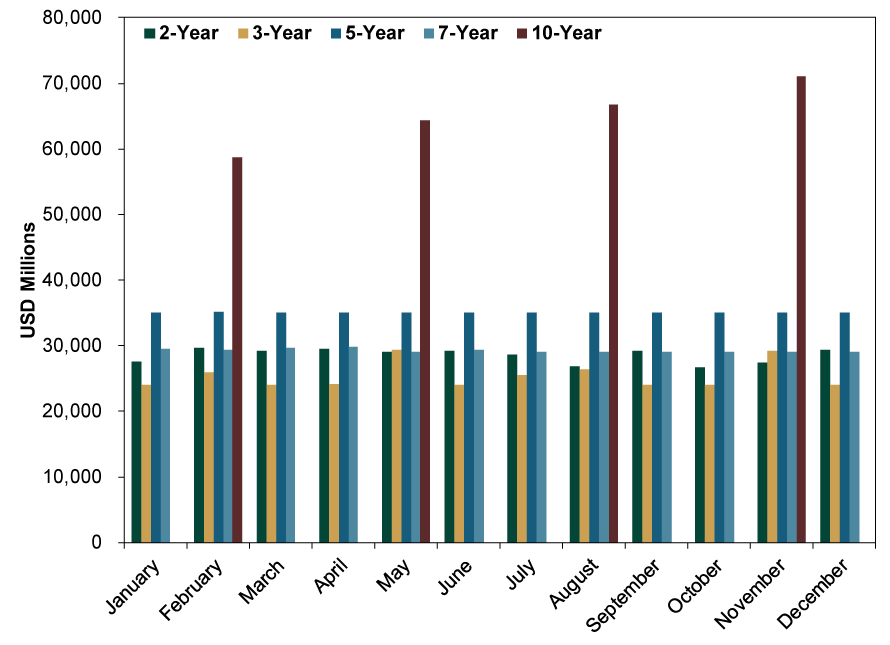
Source: US Treasury, as of 4/10/2018.
Exhibit 6 shows the maturation schedule for all net public debt. Trying to guess interest rates and refinancing decisions across this spectrum would be a fool’s errand—so we get why the CBO doesn’t try. But it also means there is no basis here for investors to make a rational assumption of long-term debt interest payments, which in turn explains the futility in fearing long-term debt today.
Exhibit 6: Scheduled Maturity of Net Public Debt
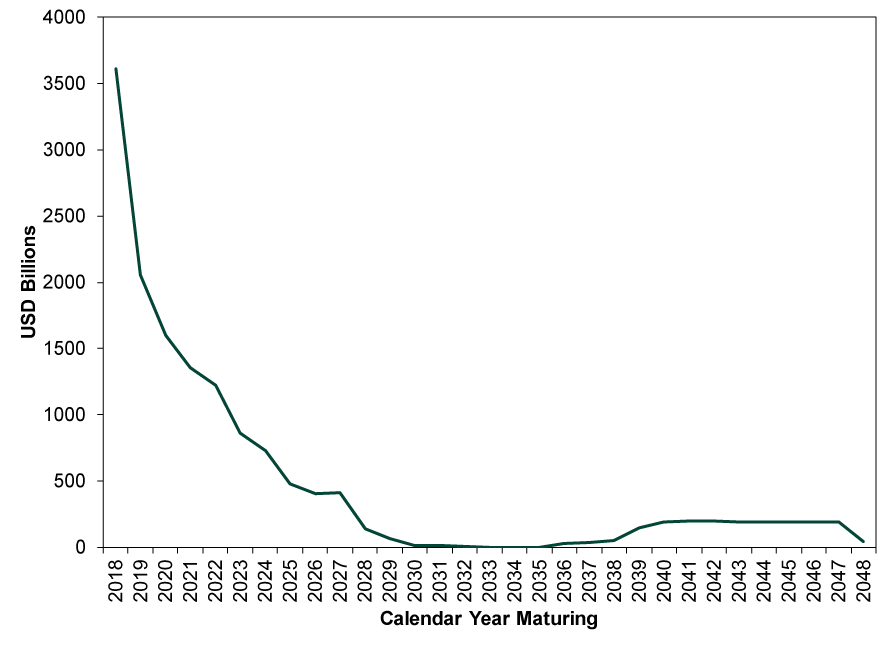
Source: US Treasury, as of 4/10/2018.
We aren’t saying the US is guaranteed to avoid a debt crisis for all of space and time—impossible to know. But debt crises also tend not to sneak up on anyone. They have pretty stark warning signs. If and when interest payments on US debt threaten to break the bank, investors will likely have time to plan accordingly. But we are a long, long, long way off from that point.If you would like to contact the editors responsible for this article, please message MarketMinder directly.
*The content contained in this article represents only the opinions and viewpoints of the Fisher Investments editorial staff.
Get a weekly roundup of our market insights
Sign up for our weekly e-mail newsletter.

You Imagine Your Future. We Help You Get There.
Are you ready to start your journey to a better financial future?

Where Might the Market Go Next?
Confidently tackle the market’s ups and downs with independent research and analysis that tells you where we think stocks are headed—and why.
Related Resources
-
In The News How investors should think about oil and stocks in the Iran war – in 3 simple steps2026-03-23
-
Expert Commentary PMIs, Denmark Snap Election, Tax Season | 3 Things You Need to Know This Week2026-03-23
-
Weekly Wrap-Up Fisher Investments Reviews: Last Week in Markets—March 16 - March 202026-03-23
-
Market Analysis Why “War Winner” Trades Are Off Base2026-03-20


Learn More
Learn why 195,000 clients trust us to manage their money and how Fisher Investments and its affiliates may be able to help you achieve your financial goals.
As of 12/31/2025
New to Fisher? Call Us.
Contact Us Today