Personal Wealth Management / Market Volatility
Thoughts on a Tough Thursday
Reacting to Thursday’s volatility and value leadership seems quite hasty to us.

After a mostly placid and strongly positive August and start to September, volatility struck on Thursday morning. As we type this at 10:20 AM Pacific Daylight Time, America’s S&P 500 Index is down -3.5% on the day.[i] In another reversal from this year’s dominant trend, big growth stocks are leading the way lower—the Russell 3000 Growth Index is down -5.0% while the Russell 3000 Value Index is down -2.1%.[ii] We have already seen pundits deploying arguments that a reversal was “due,” as stocks were “exhausted” and valuations “stretched” after the record-fast bull market put stocks back at all-time highs. But to us, it is wildly premature to think this is anything other than a brief countertrend. Perhaps—and we stress perhaps—it is the start to a correction (a short, sharp, sentiment-driven drop of -10% to -20%). But rather than a call to action, we see today’s swings as a call for calm.
Most coverage of the move notes there is no real “cause” or “trigger” for today’s swings. Economic data out Thursday contained no surprises: US initial jobless claims report showed filings fell; services purchasing managers’ indexes (PMI)—surveys tallying the breadth of growth—were above 50 (implying more respondents reported growth than contraction) in pretty much every noteworthy nation except Spain, Italy and Australia, which were all narrowly below this mark. The JPMorgan Global Composite PMI, which combines manufacturing and services, hit 52.4, a 17-month high. There were no big earnings misses or corporate proclamations; no huge political developments; no Fed announcements for commentators to blow out of proportion; no big negative developments on the coronavirus front. As we have often said, market volatility—even corrections—can strike for any or no reason. Thus far, Thursday’s drop looks like a classic example of the latter.
Sentiment-driven drops like this are uncomfortable, but they aren’t hugely uncommon in bull markets—even strongly positive early bull markets. During the record-long 2009 – 2020 bull market, the S&P 500 experienced 22 daily drops that exceeded -3%.[iii] Some occurred during corrections, like the four in 2018 (two in that year’s early correction; two in the second, late-year one). But there were also four in the bull market’s first 12 months—a period in which US stocks rose 72.3% and had no corrections at all.[iv] Volatility can be just random; we would caution against overthinking it. No bull market in history has been smooth sailing—a feature that very often bites investors that react to volatility.
The same goes for the notion growth’s larger drop signals a rotation to value leadership. Such trends aren’t smooth. There have been a number of short-term flip-flops in just the last three years—a period overall dominated by Tech and growth stocks. Exhibit 1 shows this by plotting the relative movement of the Russell 3000 Growth and Value Indexes. Some, like the two stretches in 2018, came during corrections. Others, like 2019’s, didn’t. This year has already seen several sharp periods of growth underperformance—despite the fact it is far ahead of value this year.
Exhibit 1: Growth Leadership Isn’t Smooth
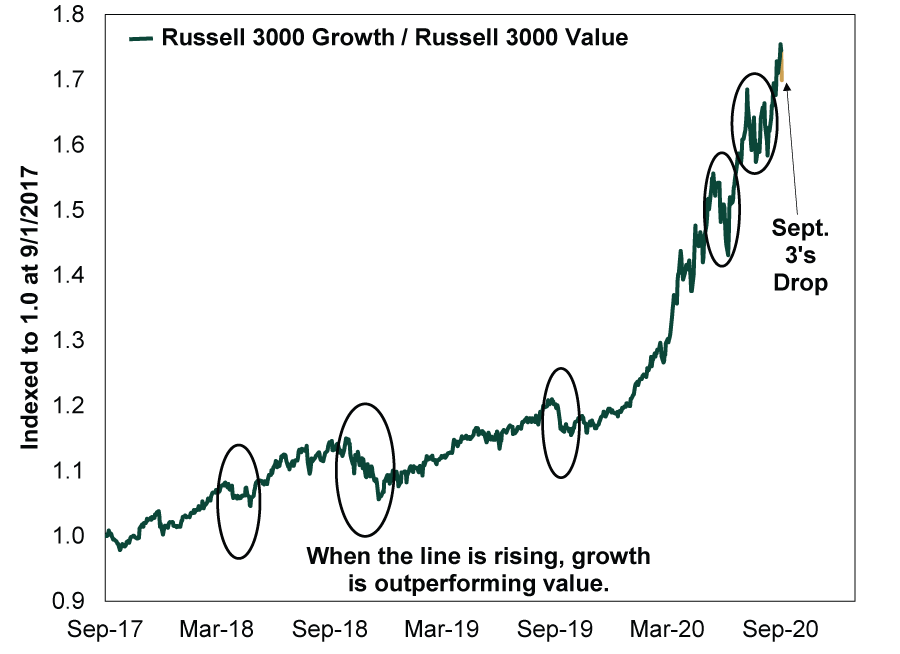
Source: FactSet, as of 9/3/2020. Russell 3000 Growth divided by Russell 3000 Value, price indexes. Note: Data for September 3 are intraday and will change by market close.
So yes, Thursday was rough—for markets generally and growth stocks in particular. But we caution against making too much of it. While we could always be facing an equity market correction, there is little sign of more than that, in our view.
Reacting to volatility early in a bull market can be exceedingly costly—causing you to miss the typically strong gains that come early and compound throughout a bull market’s life. To us, the best response to this difficult day is measured calm.
[i] Source: FactSet, as of 9/3/2020. S&P 500 price return on the day as of the time indicated.
[ii] Ibid. Russell indexes (US-specific) cited versus MSCI global indexes due to intraday data availability.
[iii] Ibid. S&P 500 days with declines of more than -3%, 3/9/2009 – 2/19/2020.
[iv] Ibid. S&P 500 total return, 3/9/2009 – 3/9/2010.
If you would like to contact the editors responsible for this article, please message MarketMinder directly.
*The content contained in this article represents only the opinions and viewpoints of the Fisher Investments editorial staff.
Get a weekly roundup of our market insights
Sign up for our weekly e-mail newsletter.

You Imagine Your Future. We Help You Get There.
Are you ready to start your journey to a better financial future?

Where Might the Market Go Next?
Confidently tackle the market’s ups and downs with independent research and analysis that tells you where we think stocks are headed—and why.
Related Resources
-
Market Analysis On the Iran Flare Up2026-07-08
-
Expert Commentary 3 Things You Need to Know This Week | Midterm Miracle, US Jobs, Tax Planning
 2026-07-07
 -
Weekly Wrap-Up Fisher Investments Reviews: Last Week in Markets—June 29 - July 32026-07-07
-
Market Analysis Can Germany Engineer Faster Growth at Last?2026-07-07


Learn More
Learn why 210,000 clients trust us to manage their money and how Fisher Investments and its affiliates may be able to help you achieve your financial goals.
As of 6/30/2026
New to Fisher? Call Us.
Contact Us Today