Personal Wealth Management / Market Analysis
US Q1 2011 GDP – A Depiction in Four Charts
The third estimate of US Q1 2011 GDP was released Friday. Here are four of many possible looks at the data.

US Q1 2011 GDP was revised up to +1.9% (seasonally adjusted annual rate) from the previously reported +1.8% growth—meeting consensus estimates. The primary driver of the upward revision was a reduction in imports, which are a detractor from GDP based on the “net exports” calculation (one major reason GDP isn’t a pure reflection of economic health, as it doesn’t reflect total trade). This is likely mostly a reflection of early effects of Japan’s earthquake.
Figure 1: US Quarterly Real GDP (Q/Q, Annualized)
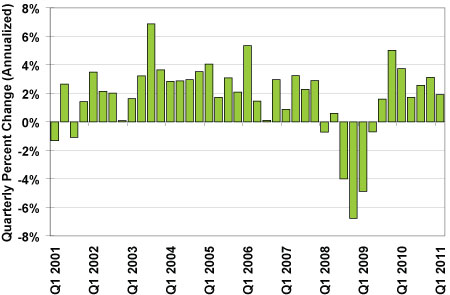
Source: Bureau of Economic Analysis, www.bea.gov.
GDP reports contain a bevy of data, and it’s possible to view this on many different levels. The chart below displays some of the major components of GDP—consumer spending (which represents the lion’s share at about 70%) along with exports, government spending and business fixed investment. The chart below indexes each component to 100 at Q1 2003.
Figure 2: Major US GDP Components
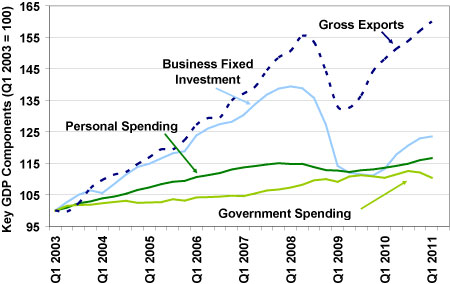
Source: Bureau of Economic Analysis, www.bea.gov.
Let’s say you’d like to examine one particular question: Are businesses deploying cash they’ve stockpiled in recent quarters, given high profitability? Drilling down even further than the above to solely isolate fixed investment, one can see this shows growth.
Figure 3: US Fixed Investment
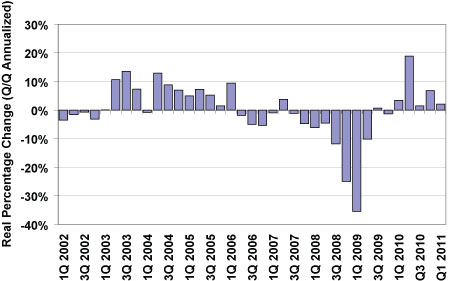
Source: Bureau of Economic Analysis, www.bea.gov.
However, even the above category may be too broad see how businesses are deploying cash. So to better see how US businesses are spending cash, it’s possible to narrow your view even further. The chart below isolates one area where US businesses have been spending and investing cash consistently since mid-2009: equipment and software.
Figure 4: US Fixed Investment in Equipment and Software
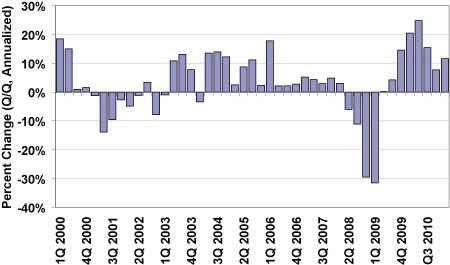
Source: Bureau of Economic Analysis, www.bea.gov.
If you would like to contact the editors responsible for this article, please message MarketMinder directly.
*The content contained in this article represents only the opinions and viewpoints of the Fisher Investments editorial staff.
Get a weekly roundup of our market insights
Sign up for our weekly e-mail newsletter.

You Imagine Your Future. We Help You Get There.
Are you ready to start your journey to a better financial future?

Where Might the Market Go Next?
Confidently tackle the market’s ups and downs with independent research and analysis that tells you where we think stocks are headed—and why.
Related Resources
-
Expert Commentary Why Ken Fisher Is Optimistic About European Stocks
 2026-07-23
 -
Economics A Summertime Check-in on US Consumers2026-07-23
-
Market Analysis Why the SOX “Bear Market” Isn’t Foreboding2026-07-21
-
Politics Blunting Burnham?2026-07-21


Learn More
Learn why 210,000 clients trust us to manage their money and how Fisher Investments and its affiliates may be able to help you achieve your financial goals.
As of 6/30/2026
New to Fisher? Call Us.
Contact Us Today