Personal Wealth Management / Economics
US Q4 2014 GDP: About That So-Called Slowdown
While headline growth slowed in Q4's preliminary read, we would suggest the underlying data confirm the US private sector is quite healthy, indeed.

According to one source, "US economic growth retreated to a modest pace in the final months of 2014, underscoring obstacles facing the recovery as troubles mount abroad." Another proclaimed, "America's recovery slowed in the fourth quarter as sluggish investment and headwinds from overseas offset a rapid acceleration in consumer spending."[i] Our advice: Don't be fooled. The fact US Q4 2014 GDP growth slowed doesn't indicate a weak economy. For one, this is the advance report of backward-looking data. Two, under the hood, this report wasn't very weak at all. For investors, we'd suggest not overthinking these data and merely taking them as confirmation the US economy finished 2014 on a solidly growth-y note.
It's true headline GDP hit a 2.6% seasonally adjusted annual growth rate in Q4 2014, which is basically half Q3's 5.0%.[ii] But this "slowdown" has some big caveats. Here are the factoids underlying Q4 GDP and their contributions to the headline growth rate.
Exhibit 1: Factoids Underlying Q4 2014 GDP Growth
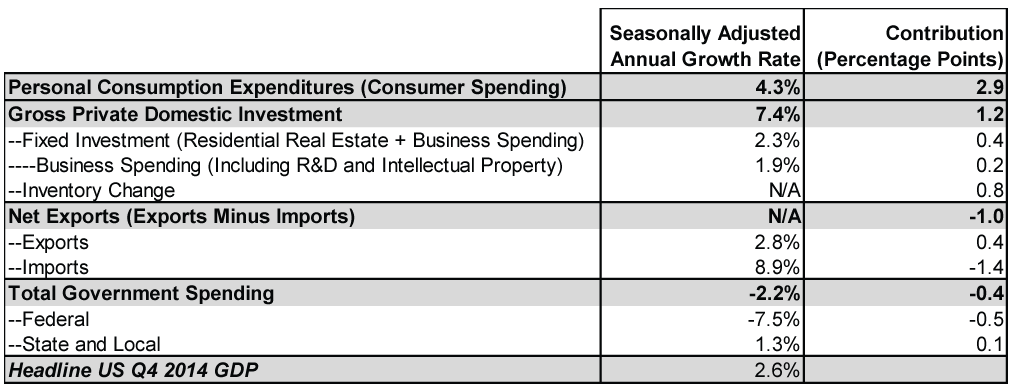
Source: US Bureau of Economic Analysis, as of 1/30/2015. Major categories are shaded and bolded. Contribution figures don't sum to 2.6% because of rounding. All this will be revised later.
Consumer spending boomed, which the media of course didn't miss. Many were quick to point out the rise-the fastest since 2006. But bizarrely, many also cited "a widening trade gap" as a negative, largely because import growth surged 8.9%, detracting 1.4 percentage points from headline growth. Yet that trade gap, in all likelihood, rose in part because consumers bought more foreign-produced goods. Import growth indicates domestic demand for foreign goods. So despite GDP's calculation treating imports as a negative, an increase isn't economically bad-one way the statistic doesn't perfectly reflect the economy.
The other major detractor was government spending, which fell -7.5%, largely reversing Q3's 9.9% advance. That rise was due mostly to a one-off 16.0% jump in defense spending. That one-off didn't become a two-off in Q4, and the drop drove the detraction. But here, too, that GDP calculations treat government spending as permanently positive doesn't mean investors should fret its drop. After all, government spending isn't always wise. They have bought $400 hammers before, which we guess is great for the hammer producer, but probably not anyone else.[iii]
What's more, this is the advance estimate-the first of three measures (at least) of Q4 growth. It will be revised. Yes, it could be revised down. But it could also be revised up. And such revisions can be substantial. Q3's 5.0% growth rate, for example, was originally reported as 3.5%. Q2's 4.6%? 4.0%. Q1 2014's weather-driven -2.1% dip was originally estimated as 0.1% growth. For those of you scoring at home, that means these three quarters' final releases skewed from the initial by 2.2, 0.6 and 1.5 percentage points, respectively. By the time you get the most accurate read, the data are anywhere from three to six months old. Stocks look forward, and such old data are ancient history.
Even if these data hold and a slowdown has arrived, slow growth was basically a constant in this bull market prior to the last few quarters.
Exhibit 2: Annual US GDP Growth
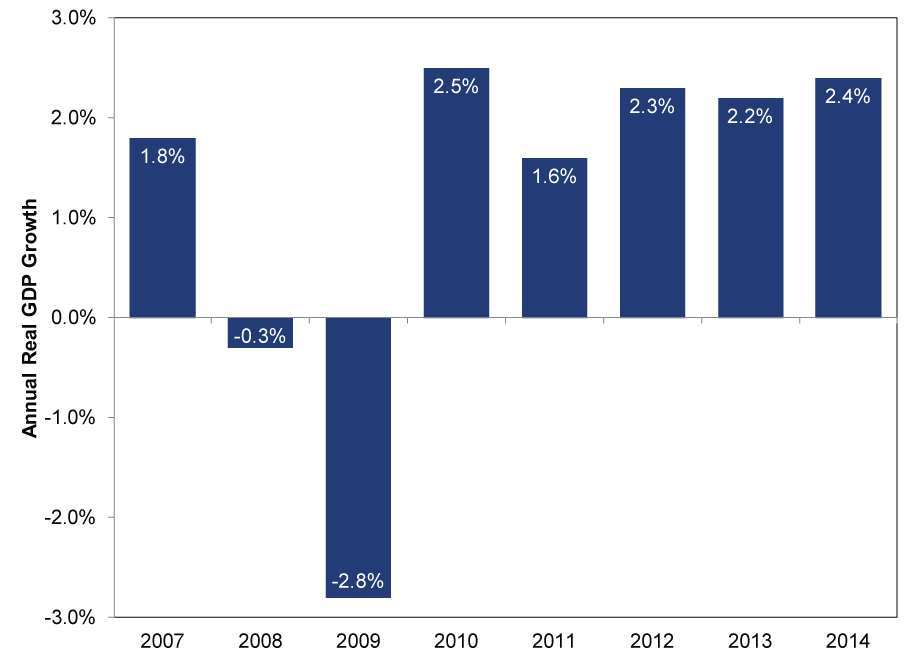
Source: US Bureau of Economic Analysis, annual real GDP growth, 2007 - 2014. Data for 2014 use preliminary Q4 data, a disclosure that may be redundant if you read the preceding few paragraphs.
This slow growth hasn't much weighed on stocks, which are up massively since the 2007 - 2009 recession ended. Why? GDP and stocks aren't moving on the same factors. GDP is an (imperfect) measure of the flow of domestic economic activity. Stocks are a function of wealth-the value of publicly traded, private-sector entities. They move most on the gap between sentiment and reality. GDP is an (imperfect) attempt to measure the latter, but it says nothing of the former.
Yes, GDP data are worth paying attention to. But we wouldn't suggest taking the degree of headline growth as an indicator of where stocks are headed. Take it more as a tally confirming stocks' earlier rise isn't built on hopes, dreams or sand. A look back at the growth we've seen can add perspective and clarity to your thinking, and that's where the real value is here, we guess.
Exhibit 3: US Real GDP Growth and Level, 2007 - 2014
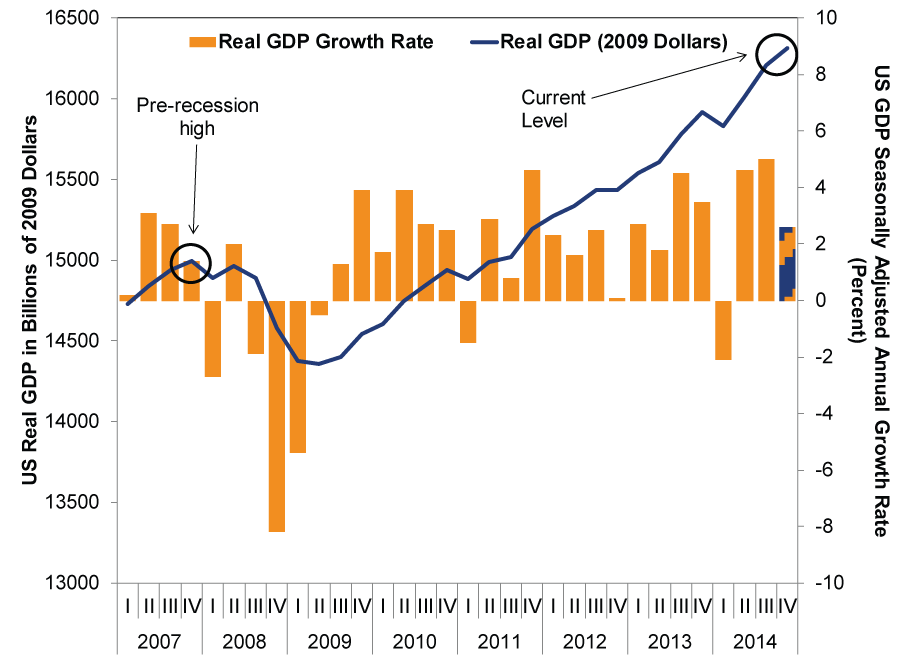
Source: US Bureau of Economic Analysis, Quarterly US Real GDP Growth and Level, Q1 2007 - Q4 2014. Q4, again, preliminary, will be revised, probably not right, maybe by a lot. Hence, the column's pattern.
Stock Market Outlook
Like what you read? Interested in market analysis for your portfolio? Why not download our in-depth analysis of current investing conditions and our forecast for the period ahead. Our latest report looks at key stock market drivers including market, political, and economic factors. Click Here for More!
[i] This is a super econo-nerdy objection, but technically speaking, America's recovery has been over since 2012. You see, recovery technically means growing GDP, but below prior peak. Once you eclipse that peak, you are in expansion, not recovery. So the media take here should read, "America's expansion slowed in the fourth quarter as sluggish investment and headwinds from overseas offset a rapid acceleration in consumer spending."
[ii] Source: US Bureau of Economic Analysis, as of 1/30/2015.
[iii] It's really an aside and too far afield here, but the government doesn't have money of its own, either. It spends other people's and businesses' money. So the hammer producer may not have benefited from selling the $400 hammer as much as the price tag may suggest.
If you would like to contact the editors responsible for this article, please message MarketMinder directly.
*The content contained in this article represents only the opinions and viewpoints of the Fisher Investments editorial staff.
Get a weekly roundup of our market insights
Sign up for our weekly e-mail newsletter.

You Imagine Your Future. We Help You Get There.
Are you ready to start your journey to a better financial future?

Where Might the Market Go Next?
Confidently tackle the market’s ups and downs with independent research and analysis that tells you where we think stocks are headed—and why.
Related Resources
-
Market Analysis The Golden Paradox2026-03-24
-
In The News How investors should think about oil and stocks in the Iran war – in 3 simple steps2026-03-23
-
Expert Commentary PMIs, Denmark Snap Election, Tax Season | 3 Things You Need to Know This Week2026-03-23
-
Weekly Wrap-Up Fisher Investments Reviews: Last Week in Markets—March 16 - March 202026-03-23


Learn More
Learn why 195,000 clients trust us to manage their money and how Fisher Investments and its affiliates may be able to help you achieve your financial goals.
As of 12/31/2025
New to Fisher? Call Us.
Contact Us Today