Personal Wealth Management / Economics
What the August Jobs Report Does and Doesn’t Tell Investors
Sifting through the noise surrounding August’s US jobs report.

Last week’s release of the US August Employment Situation Report—aka, the jobs report—triggered myriad reactions. While most commentary acknowledged the numbers were largely positive, some experts still sounded summertime sirens. Either way, in our view, folks are reading much too much into backward-looking jobs data—they tell you what the economy has done, not what will happen next.
Per the BLS, employers added 130,000 nonfarm jobs, more growth following July’s revised gain of 159,000. The widely watched unemployment rate stayed near a 50-year low at 3.7%—same as June and July’s rate. The labor force participation rate—the ratio of the civilian labor force to the total civilian population[i] was 63.2%, around where it has been for the past several years. Overall, August’s numbers are pretty much par for the course. No head-scratching outliers to see here: The US expansion has been chugging along for a decade, and these data confirm that growth.
Yet some pundits used August’s jobs as evidence for their preferred dour narrative—a sign of widespread pessimism. Those worried about a slowing expansion noted nonfarm jobs’ current three-month average gain is 156,000—weaker than 2018’s 241,000 average over the same period.[ii] Others added that the government’s hiring of 25,000 temporary Census Bureau workers “propped up” August’s number. The global manufacturing soft patch colored coverage, too, as some pointed out how the US manufacturing sector added 3,000 jobs in August and just 27,000 for the year—much weaker than 2017’s 91,000 and 2018’s 154,000 through August.[iii] All these concerns added fuel for those forecasting an interest rate cut at the Fed’s September meeting, with some analysts convinced August’s jobs report shows more easing is needed.
In our view, these storylines overlook a critical limitation of economic data: They are backward-looking and don’t tell you anything about the economy’s upcoming prospects. Labor data are particularly lagging as they reflect past business decisions. Put yourself in a business owner’s shoes. A new employee is an investment of money, time and resources. You will likely try to get by with what you have until it is absolutely necessary to add headcount. Likewise, because of that investment, you won’t cut headcount until falling sales or fast-rising costs force your hand. Said simply: Economic growth drives hiring, not the other way around.
Even the forward-looking takeaways from the jobs report seem off, in our view. A popular one: Weaker hiring will hurt household spending—a huge swath of the US economy. While this sounds logical, reality is a bit more complex. Services spending—which comprises the majority of consumer spending—tends to be inelastic, which is a jargony way to say it doesn’t fluctuate much. Recent history shows this to be the case. As Exhibit 1 illustrates, personal consumption didn’t contract as sharply as employment during the last recession—and it recovered more quickly, too.
Exhibit 1: Jobs Doesn’t Drive Consumer Spending
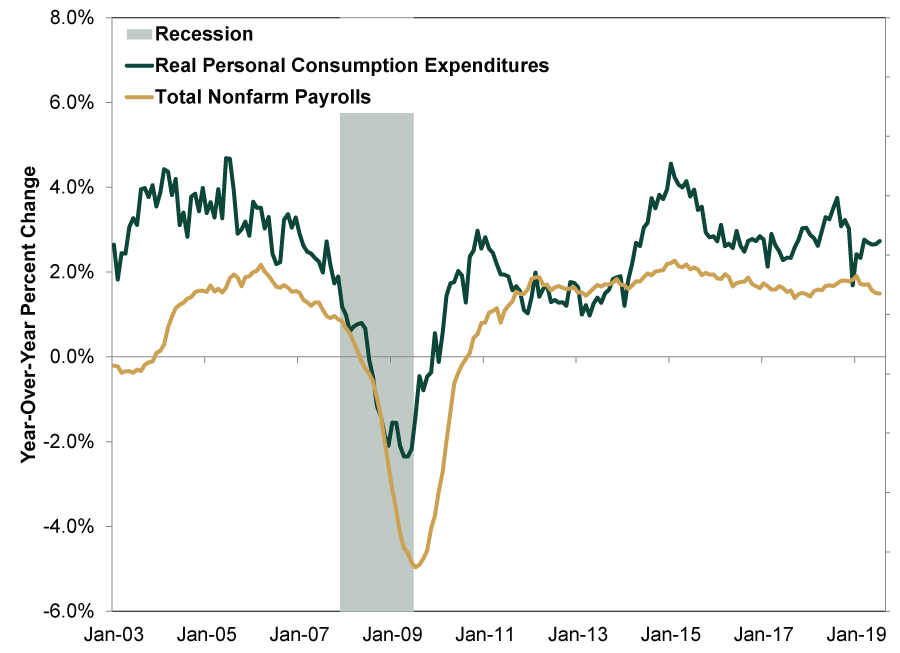
Source: St. Louis Fed’s FRED, as of 9/10/2019. Year-over-year percent change in real personal consumption expenditures and total nonfarm payrolls, January 2003 – July 2019. Recession dating via NBER.
Exhibit 1 also dispels the myth hiring drives spending. If it did, how did personal consumption return to growth even as the economy continued shedding jobs? Go back a little further to the 2001 recession, when the economy lost 1.6 million jobs.[iv] On a quarterly basis, consumer spending didn’t contract—it grew that whole year.[v]
While jobs data provide plenty of information, remember their limits. They are unlikely to tell you where the economy is headed next. Though recent reports haven’t been great—especially overseas—slowdowns aren’t uncommon during global expansions. More importantly, a spate of weaker data doesn’t mean recession or bear market loom.
[i] A count that doesn’t include everyone, e.g., those in prison.
[ii] Source: BLS, as of 9/10/2019.
[iii] Ibid.
[iv] Source: BLS, as of 9/10/2019. The difference in US total nonfarm payrolls between March 2001 – November 2001—NBER’s dating for the 2001 recession.
[v] Source: St. Louis Federal Reserve via FRED. Real personal consumption expenditures, annualized percent change, Q1 2001 – Q4 2001.
If you would like to contact the editors responsible for this article, please message MarketMinder directly.
*The content contained in this article represents only the opinions and viewpoints of the Fisher Investments editorial staff.
Get a weekly roundup of our market insights
Sign up for our weekly e-mail newsletter.

You Imagine Your Future. We Help You Get There.
Are you ready to start your journey to a better financial future?

Where Might the Market Go Next?
Confidently tackle the market’s ups and downs with independent research and analysis that tells you where we think stocks are headed—and why.
Related Resources
-
In The News In Orbit? On Tech Sentiment and IPOs2026-05-22
-
Market Analysis Global Bond Calamity Calls for Calm Perspective2026-05-22
-
Expert Commentary This Week in Review | UK Politics, Fed Developments, IPOs
 2026-05-22
 -
Market Analysis CPI Sheds Light on Britain’s Price ‘Cap’ Conundrum2026-05-20


Learn More
Learn why 200,000 clients trust us to manage their money and how Fisher Investments and its affiliates may be able to help you achieve your financial goals.
As of 3/31/2026
New to Fisher? Call Us.
Contact Us Today