Personal Wealth Management / Market Analysis
Tariffs’ Bark Remains Worse Than Their Bite
August economic data show tariffs haven’t crimped US and China growth.

Trade fears have whipped up again, with headlines fretting President Trump’s announcement late Monday of tariffs on another $200 billion in Chinese imports, effective September 24. Many worry this could endanger the incremental negotiation progress between the world’s two largest economies. However, in our view, nothing significant has changed. These tariffs were first threatened in March, studied beginning in July and widely considered a done deal in August—in other words, old news to forward-looking markets. Amid the latest hubbub, both countries released August economic data, covering the second month with previously enacted tariffs in effect. Overall, the numbers show tariffs have yet to crimp growth—and we don’t expect this to meaningfully change when (or if) more tariffs take effect.
In the US, August industrial production rose 0.4% m/m (4.9% y/y), its third straight gain. Manufacturing output rose 0.2% m/m, as did Utilities (1.2%) and Mining (0.7%). It is possible tariff worries brought activity forward as businesses tried to get ahead of escalating duties. But this also suggests businesses are adjusting as necessary. Tariffs may inconvenience folks, but those implemented or discussed recently aren’t a business killer.
Exhibit 1: US Industrial Production in 2018
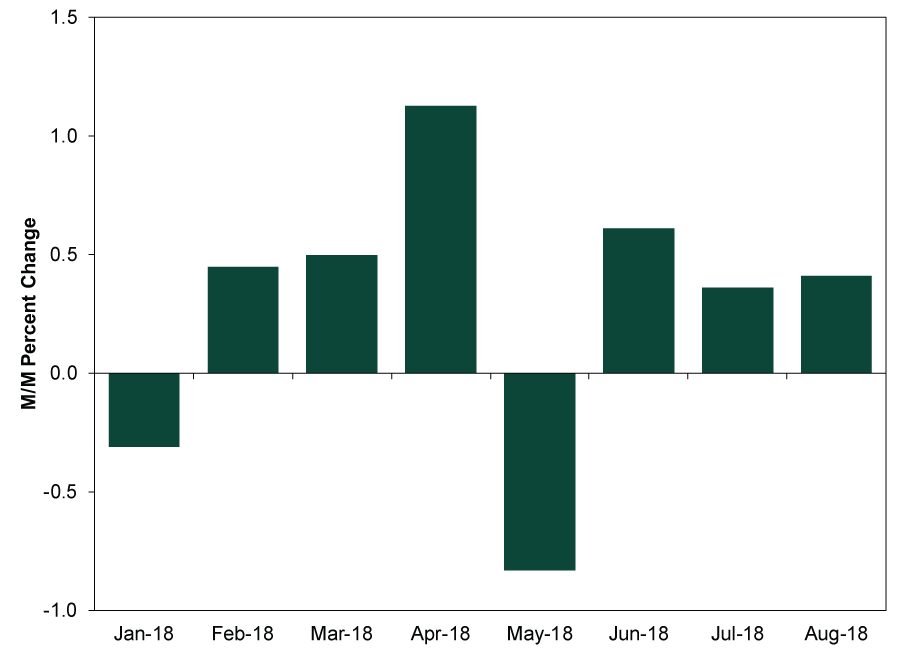
Source: FactSet, as of 9/20/2018. Monthly percent change for US industrial production, January 2018 – August 2018.
Moreover, other data show consumption—a much larger segment of the US economy—continues chugging along. August retail sales ticked up 0.1% m/m, weaker than expected, though excluding volatile auto sales, they were a bit better (0.3%). July retail sales were revised up from 0.5% to 0.7%. August marks retail sales’ seventh straight monthly rise, and while they cover only a part of consumer spending, more comprehensive gauges—like the BEA’s personal consumption expenditures—remain in positive trends, too.
Exhibit 2: US Retail Sales and Personal Consumption Expenditures in 2018
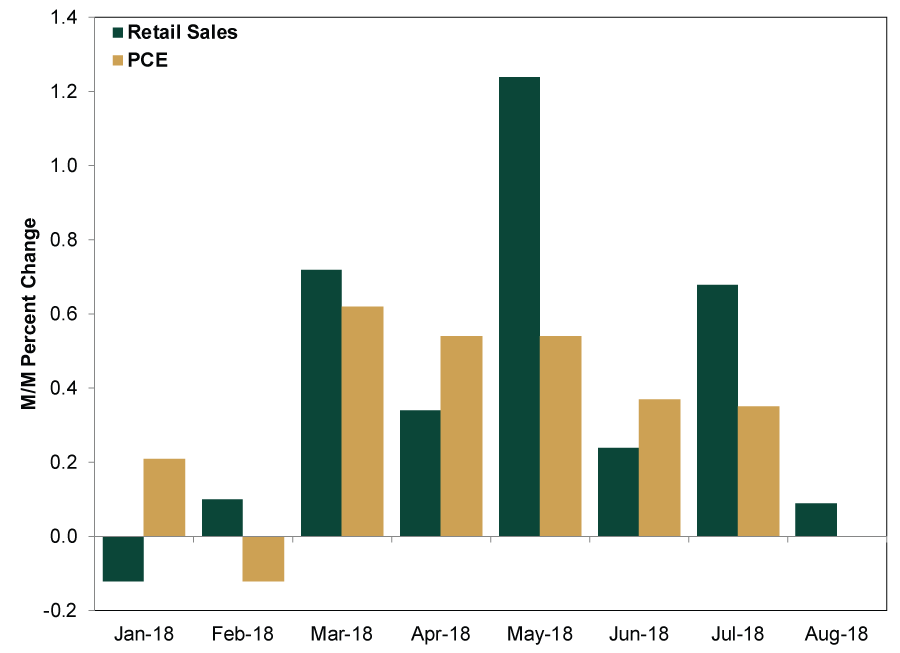
Source: FactSet, as of 9/20/2018. Monthly percent change for US retail sales and personal consumption expenditures (PCE), January 2018 – August 2018. Note: August PCE is not available yet.
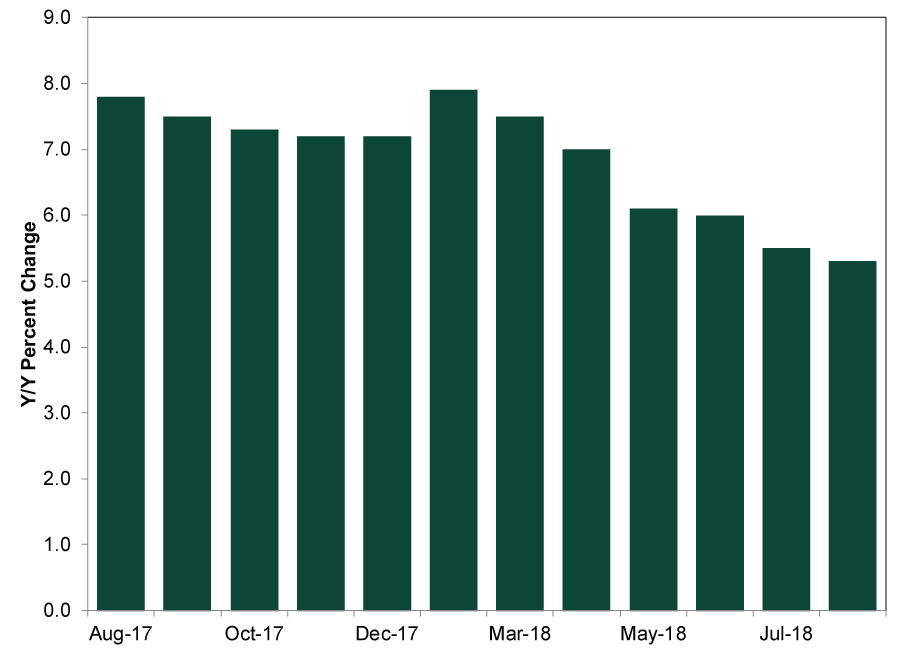
China’s August data were similarly growthy. Retail sales (9.0% y/y) and industrial production (6.1%) improved on July’s growth rates (8.8% and 6.0%, respectively) while fixed asset investment slowed a tad—rising 5.3% year-to-date y/y (vs. July’s 5.5%).
Exhibit 3: China Retail Sales, August 2017 – August 2018
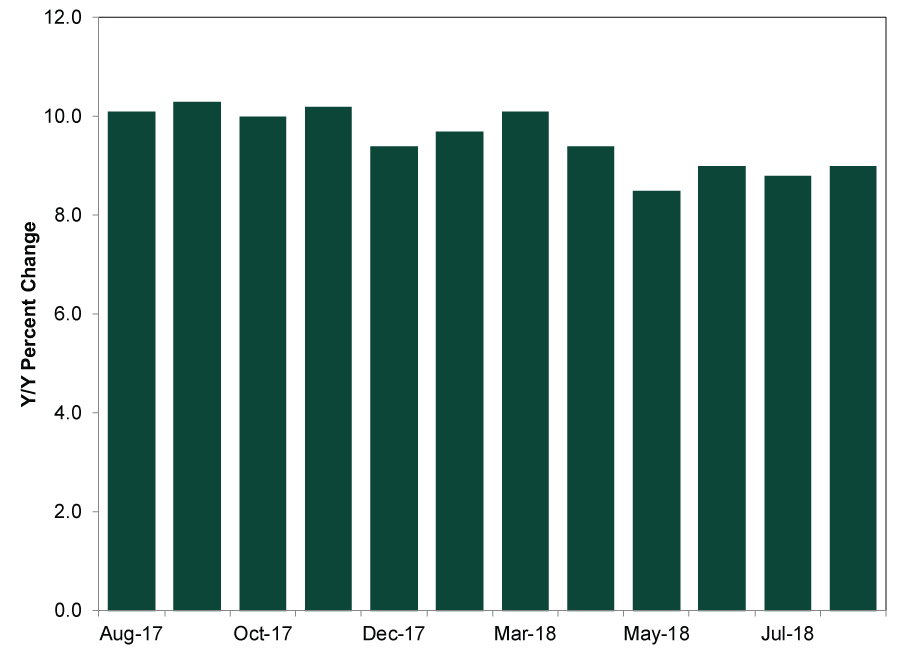
Source: National Bureau of Statistics of China, China Retail Sales year-over-year percent change, August 2017 – August 2018. Note: January and February data are combined to account for Lunar New Year distortions.
Exhibit 4: China Industrial Production, August 2017 – August 2018
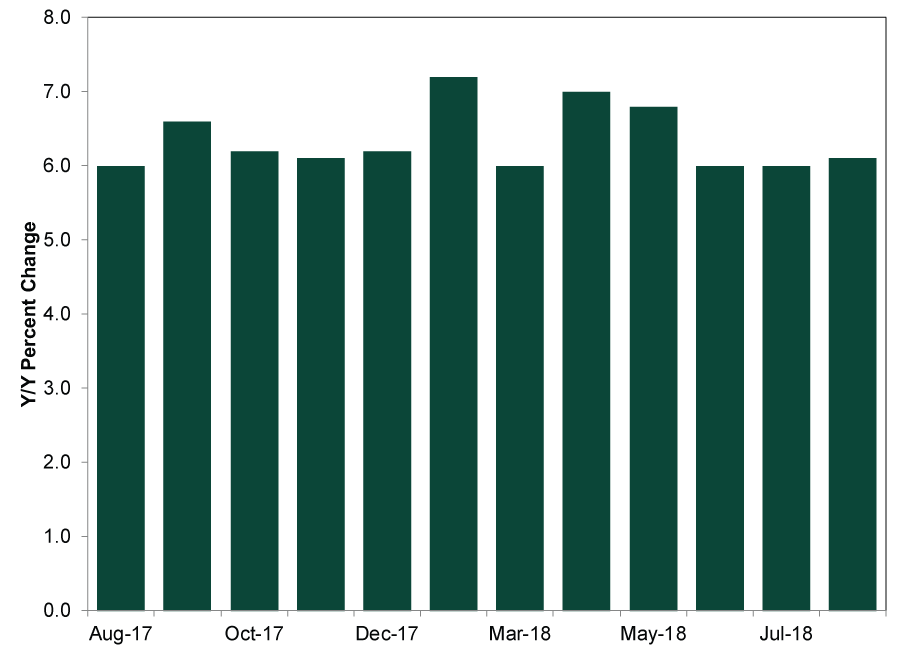
Source: National Bureau of Statistics of China, China Industrial production year-over-year percent change, August 2017 – August 2018. Note: January and February data are combined to account for Lunar New Year distortions.
Exhibit 5: China Fixed Asset Investment, August 2017 – August 2018
Source: National Bureau of Statistics of China, China fixed asset investment, year-to-date, year-over-year percent change, August 2017 – August 2018. Note: January and February data are combined to account for Lunar New Year distortions.
Many analysts suggested tariffs were weighing on growth, but the story is a bit more complicated than that. Though trade worries may add some uncertainty, China has also focused on taming credit growth this year—particularly in its opaque shadow banking sector. As regulators pumped the brakes on credit, traditional loan growth hasn’t offset the shadow banking pullback, prompting the government to relax some of its restrictions in mid-July. August is the first full month in which all announced policies have been in place, and the government just announced further support targeted at boosting domestic demand. Policymakers will likely continue limited stimulus measures to spur growth along, as maintaining social stability remains the government’s primary objective. That said, slower economic growth isn’t a recent phenomenon for China—it has been the trend for years.
Exhibit 6: China GDP Growth Since 2013
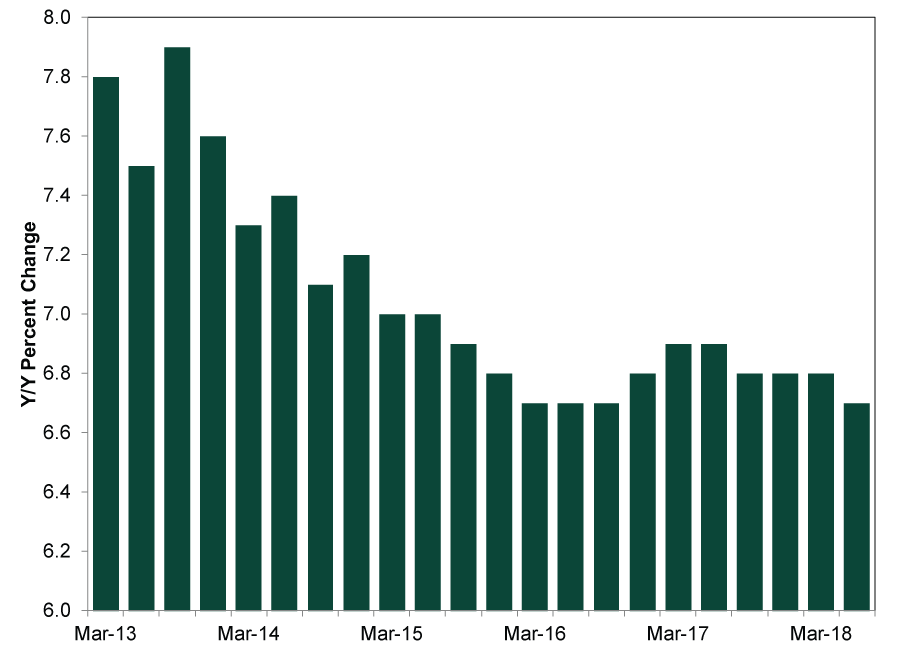
Source: FactSet, as of 9/20/2018. Year-over-year GDP percent change, quarterly, Q1 2013 – Q2 2018.
The first tranche of tariffs took effect July 6, making July data an early glimpse and August the first full look at the trade spat’s fallout. While a small sample size, the data remain in step with broader trends. We aren’t saying tariffs will have no effect—especially if they escalate into something bigger and more global. But based on what we know now, tariffs seem to lack the scale to meaningfully dent growth. Unless that changes, tariffs’ bark likely remains worse than their bite.
If you would like to contact the editors responsible for this article, please message MarketMinder directly.
*The content contained in this article represents only the opinions and viewpoints of the Fisher Investments editorial staff.
Get a weekly roundup of our market insights.
Sign up for our weekly e-mail newsletter.

See Our Investment Guides
The world of investing can seem like a giant maze. Fisher Investments has developed several informational and educational guides tackling a variety of investing topics.
SHARE THIS MEDIA


Related Resources


Learn More
Learn why 150,000 clients* trust us to manage their money and how we may be able to help you achieve your financial goals.
*As of 3/31/2024
New to Fisher? Call Us.
Contact Us Today