Personal Wealth Management /
Such Great Heights
Don’t be scared stocks are hitting all-time high marks—a fear of heights may lead to investors missing out on the bull market’s upside.

The recent spate of all-time market highs continued Wednesday, with the Dow once again closing at record levels and the S&P 500 Price Index closing within a hair of its own high-water mark. And as usual, along with new heights comes folks wondering if what goes up must go down. Near-term, some downside is always possible, but “all-time high” isn’t synonymous with “apex.” At some point, this bull will hit its ultimate all-time high and inflection point, but between now and then, stocks likely reach many more all-time highs, and none will predict future returns.
Fear of heights is based on a fundamental fallacy: the belief past performance determines future returns. Take a poll, and you’ll be hard pressed to find anyone who believes that statement, in a vacuum, is true—it’s near-universally known stocks are forward looking. Markets don’t move on past events. They move according to the gap between investors’ expectations of future corporate profitability and reality. This has nothing to do with past price performance and everything to do with expectations for economic growth, world trade, the political climate, potential regulatory changes and many, many more. The index’s current level has no bearing on how markets weigh these factors.
Hence why bull markets have historically hit dozens—even hundreds—of new highs during their lifespans. Take the current bull market, shown in Exhibit 1. To date, the S&P Total Return Index—a broad, cap-weighted index that includes dividends along with price appreciation—has hit 68 new highs.
Exhibit 1: S&P 500 Total Return Index New All-Time Highs, 2009-Present
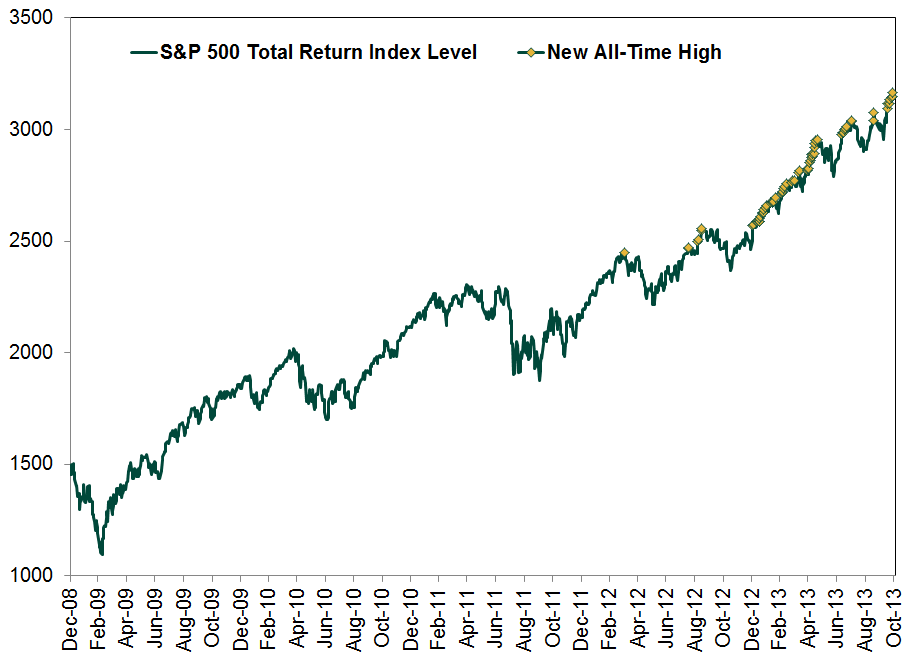
Source: FactSet Data Systems, Inc., as of 11/5/2013. S&P 500 Total Return Index from 12/31/2008-11/4/2013.
Number 68 isn’t any more meaningful or predictive than the 67 prior. The index is up 29% since hitting this bull’s first all-time high on 4/2/2012, though the short-term movement after each new high during that span has varied. So, too, has the frequency of new highs. It took over four months to hit the second all-time high on 8/16/2012, but in the past month, we’ve seen seven. Not predictable, bullish or bearish—just random. New records have been far clumpier this year as markets haven’t seen a significant correction, and perhaps that’s why we’re seeing more all-time high chatter these days than, say, six months ago. Maybe a correction lurks around the corner—but maybe not. Either way, corrections aren’t bear markets—they’re normal, healthy features of any bull market. They’re also impossible to predict or time with any certainty, and investors who try to steer clear of one today simply because the market is at new highs could very well miss future upside.
The 1990s bull market sets an even starker example (see Exhibit 2). This decade-long bull market saw 347 new closing highs! Between the first high in 1990 and the last in March 2000, the S&P returned 411%—succumbing to fear of heights at just about any point in between would have been a costly decision.
Exhibit 2: S&P 500 Total Return Index New All-Time Highs, 1990-2000
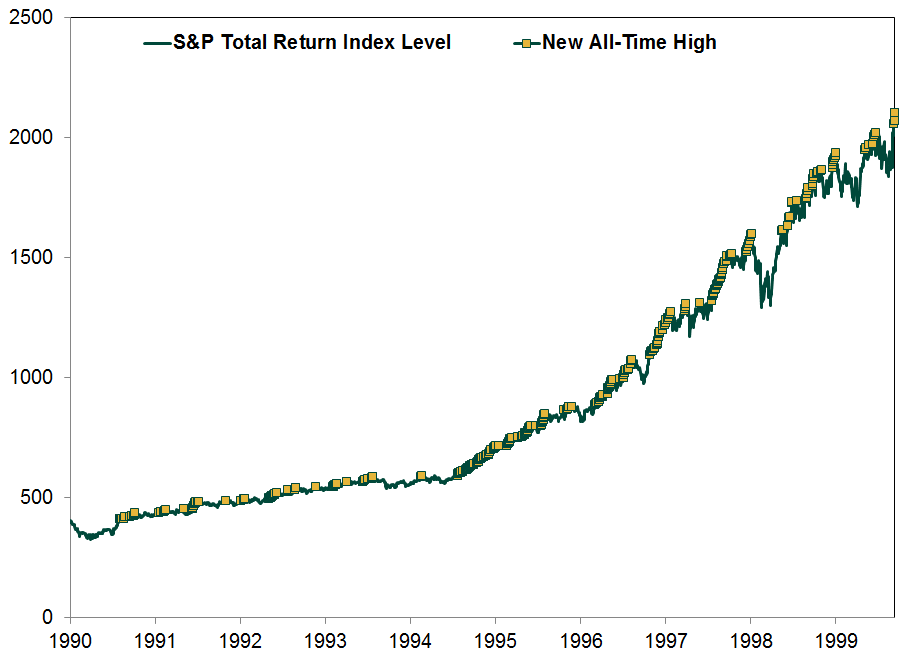
Source: FactSet Data Systems, Inc., as of 10/11/2013. S&P 500 Total Return Index from 12/31/1989-12/31/2000.
At some point, this bull market too will hit its last all-time high, and a bear market will begin. But it won’t have anything to do with the index level—peaks are only clear in hindsight—and the environment then will likely look different than today’s. As Sir John Templeton said, “Bull markets are born on pessimism, grow on skepticism, mature on optimism and die on euphoria.” Peaks typically feature euphoric investor sentiment—cheerful investors who don’t notice deteriorating fundamentals and some big, bad thing that could impact global commerce or corporate profitability. For example, the 2000 bear market kicked off as investors cheered on a “new age” led by the dot-com IPOs—ignoring a falling LEI and the fact many of those companies had unprofitable business models.
Today, we have the opposite. LEI is high and rising, earnings and revenues are growing (albeit slowly) and beating expectations, yield curves are steepening and many parts of the world economy are accelerating—fuel for future earnings growth. Many investors don’t notice these positives, however, as sentiment remains firmly rooted in skepticism. Many investors still seem preoccupied with false fears (e.g. the Fed’s potential taper of quantitative easing) or near-evergreen items like US debt. This gap between sentiment and reality is a bullish feature—it lays the groundwork for more all-time highs ahead.
If you would like to contact the editors responsible for this article, please message MarketMinder directly.
*The content contained in this article represents only the opinions and viewpoints of the Fisher Investments editorial staff.
Get a weekly roundup of our market insights
Sign up for our weekly e-mail newsletter.

You Imagine Your Future. We Help You Get There.
Are you ready to start your journey to a better financial future?

Where Might the Market Go Next?
Confidently tackle the market’s ups and downs with independent research and analysis that tells you where we think stocks are headed—and why.
Related Resources
-
Market Analysis Why the SOX “Bear Market” Isn’t Foreboding2026-07-21
-
Politics Blunting Burnham?2026-07-21
-
Expert Commentary 3 Things You Need to Know This Week | Q2 Earnings, ECB Meeting, Trump Accounts
 2026-07-20
 -
Weekly Wrap-Up Fisher Investments Reviews: Last Week in Markets—July 13 - July 172026-07-20


Learn More
Learn why 210,000 clients trust us to manage their money and how Fisher Investments and its affiliates may be able to help you achieve your financial goals.
As of 6/30/2026
New to Fisher? Call Us.
Contact Us Today