Personal Wealth Management / Economics
Why We Don't Think December's US LEI Dip Signals Trouble
False signals—particularly driven by sentiment-driven stock market volatility—aren’t uncommon.

Last week, The Conference Board reported its US Leading Economic Index (LEI) declined -0.1% m/m—the second dip in three months. To some, this may seem concerning—especially with economic worries running high. But in our view, a look under the hood suggests LEI’s dip likely isn’t foreshadowing recession.
LEI mashes together 10 components, an effort to craft a broad-based forward-looking indicator. It is useful—LEI has declined for a period of months before every US recession since 1959.[i] But, like any economic indicator, there are false signals. Exhibit 1 shows a fair number of false warnings just since 2002.
Exhibit 1: LEI False Signals
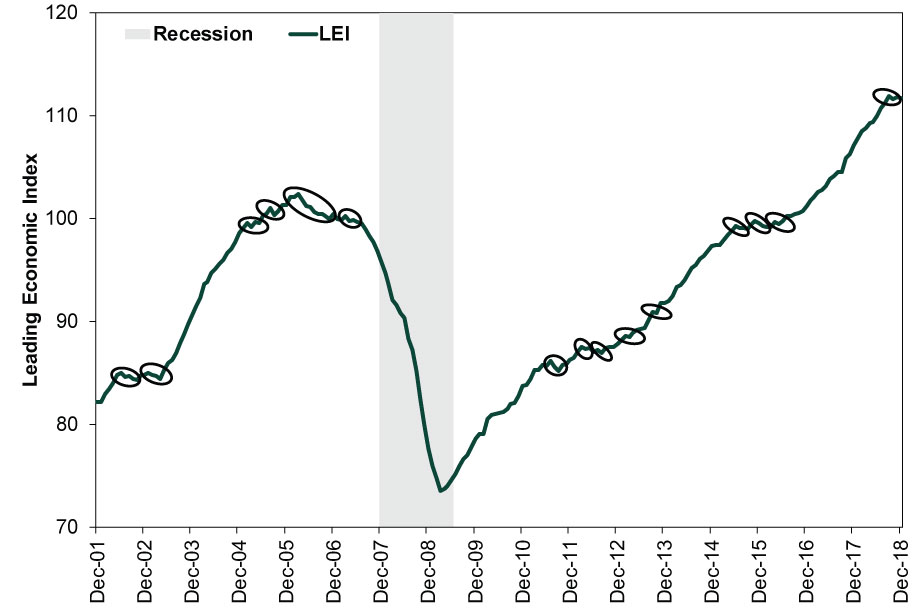
Source: FactSet, as of 1/25/2019. US LEI, January 2002 – December 2018. Shaded area represents recession as defined by the National Bureau of Economic Research.
One way to separate those from real dips: Dig into the components. In December, only 3 of 10 declined, driving the index’s dip.
Exhibit 2: LEI Components’ Contributions to Index Change
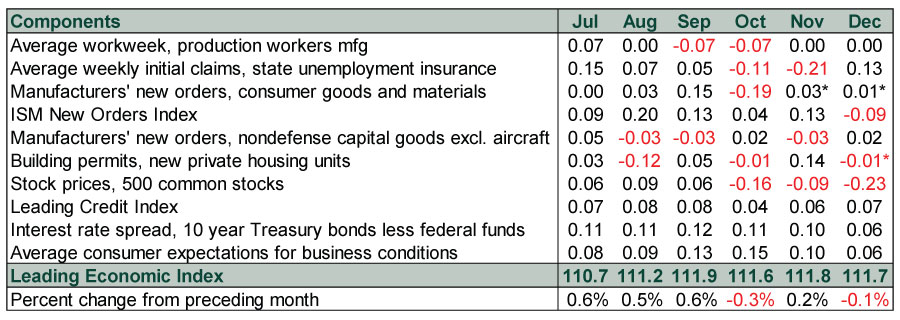
Source: The Conference Board, as of 1/25/2019. LEI components’ contributions, July 2018 – December 2018. *Due to the government shutdown, these figures are The Conference Board’s estimates.
While the yield curve—noted as the interest rate spread in LEI—flattened in December, limiting its contribution to LEI, it remains positive. So does the Leading Credit Index. In concert, these imply lending should remain available, fueling economic growth. Further, 10-year Treasury yields are up in January, steepening the curve some. These credit gauges are among LEI’s most predictive pieces—in our view, strong evidence a downturn isn’t looming.
Moreover, we suggest taking the three negative components with a grain of salt. Stocks were the biggest detractor—by far. That shouldn’t shock, given December’s sharp volatility. That said, we think December’s negativity was part of a sentiment-driven move—a correction—not tied to fundamental weakness. As economist Paul Samuelson once quipped, “Stocks have predicted nine of the last five recessions.” They are a leading indicator, but not all volatility indicates trouble ahead.
January’s rebound should partly reverse the dip, although LEI’s methodology may mitigate the scope. LEI compares the average daily close to the prior month’s. Our calculations show this implies a 1.1% S&P 500 gain (in price terms) in January—below the index’s actual 5.5% gain.[ii]
The second-largest detractor: ISM Manufacturing’s New Orders Index. However, this stems from another LEI calculation quirk. December’s new orders were 51.1, implying more than half of respondents indicated growth. Expansionary per ISM! But LEI compares the current reading to new orders’ long-term average. December’s downtick—that may prove a one-off, not a trend—happened to be below that arbitrary mark.
The third, residential building permits detracted 0.01 percentage point. However, this isn’t actual data—the government shutdown prevented December’s release. Hence, the Conference Board estimated it (and consumer goods orders). Fair enough, but estimates can be wrong. Even if the dip does hold in actual data, the detraction was a rounding error related to 3.9% of US GDP.[iii] The impact is tiny.
Of course, October and December dips could begin a more sustained downturn, presaging recession. But given the caveats around December, it doesn’t appear likely to us. In our view, LEI’s weak Q4 likely proves a false read.[i] Source: FactSet, as of 1/29/2019. LEI and recessions as defined by the National Bureau of Economic Research.
[ii] Source: FactSet, as of 1/29/2019. S&P 500 price return, 12/31/2018 – 1/28/2018.
[iii] Source: Bureau of Economic Analysis, as of 1/28/2018. Residential fixed investment in structures as a percent of GDP, Q3 2018.
If you would like to contact the editors responsible for this article, please message MarketMinder directly.
*The content contained in this article represents only the opinions and viewpoints of the Fisher Investments editorial staff.
Get a weekly roundup of our market insights
Sign up for our weekly e-mail newsletter.

You Imagine Your Future. We Help You Get There.
Are you ready to start your journey to a better financial future?

Where Might the Market Go Next?
Confidently tackle the market’s ups and downs with independent research and analysis that tells you where we think stocks are headed—and why.
Related Resources
-
Market Analysis On the June Inflation Cooldown2026-07-14
-
Expert Commentary 3 Things You Need to Know This Week | US Inflation, China GDP, US Retail Sales
 2026-07-13
 -
Weekly Wrap-Up Fisher Investments Reviews: Last Week in Markets—July 6 - July 102026-07-13
-
Expert Commentary This Week in Review | Global PMIs, SpaceX, RMD Planning
 2026-07-10


Learn More
Learn why 210,000 clients trust us to manage their money and how Fisher Investments and its affiliates may be able to help you achieve your financial goals.
As of 6/30/2026
New to Fisher? Call Us.
Contact Us Today