Personal Wealth Management / Market Analysis
Checking In on the Yield Curve
Little-noticed, properly constructed yield curves have steepened a bit lately.

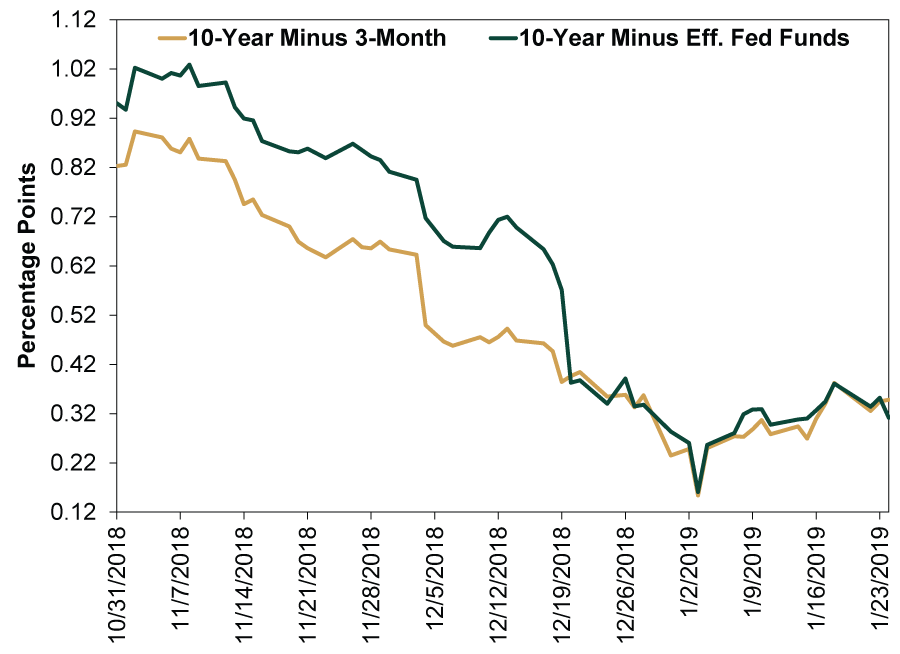
In early December, when the 5-year minus 2-year Treasury yield curve inverted, folks freaked. Even many who (correctly, in our view) accepted that this combination of maturities made little to no sense viewed it as a prelude to inversions in the more meaningful yield curves—the 10-year minus 3-month and 10-year minus fed-funds. The implication: Interest rate moves are self-fulfilling prophecies, making it only a matter of time before the gap between further-apart rates closed as well. Nearly two months after the 5-year minus 2-year curve first inverted, it remains so, despite a late December flip-flop. (Exhibit 1). However, the supposedly automatic inversion in other curves still hasn’t happened yet. Actually, the better-constructed curves have actually steepened a wee bit this month (Exhibit 2).
Exhibit 1: The Wrong Yield Curve
Source: FactSet, as of 1/25/2019. 5-year Treasury yield minus 2-year Treasury yield, 10/31/2018 – 1/24/2018.
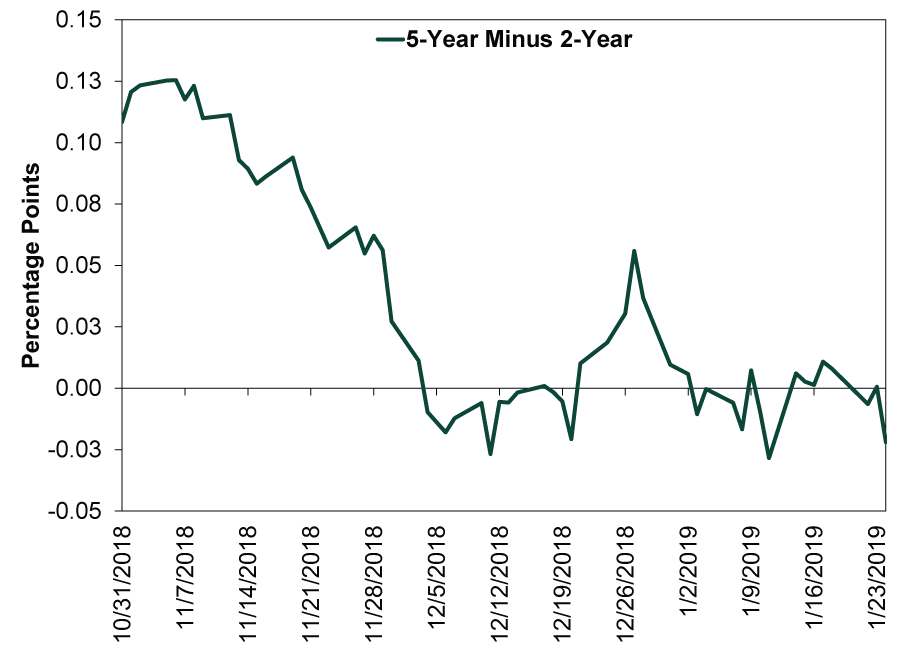
Exhibit 2: Better Yield Curves
Source: FactSet, as of 1/25/2019. 10-year Treasury yield minus 3-month Treasury yield and 10-year Treasury yield minus effective fed funds rate, 10/31/2018 – 1/24/2018.
This underscores why we didn’t view the 5-year minus 2-year curve’s inversion as a recession harbinger—and why we still don’t. It remains profitable for banks to borrow at short-term rates and lend long-term—even more so when you consider that the global yield curve is somewhat steeper than America’s. For the yield curve to signal recession, the 10-year minus fed-funds and 10-year minus 3-month curves generally must invert and stay there. A short inversion that reverses quickly generally isn’t enough to tank lending, and monetary policy developments usually filter through to the broader economy at a lag.
Flatter yield curves can contribute to slower growth, and perhaps we see that this year. But slower growth isn’t a recession. Nor is it inherently bad for stocks, which don’t have a set relationship with economic growth rates. An economic reality that generally beats expectations, regardless of the actual growth rate, is typically good enough.
So keep an eye on yield curves, but don’t overthink them, and don’t waste energy trying to predict an inversion. Just wait until it actually happens, see how long it lasts, and go from there. Yield curves aren’t timing tools—just loose leading indicators.
If you would like to contact the editors responsible for this article, please message MarketMinder directly.
*The content contained in this article represents only the opinions and viewpoints of the Fisher Investments editorial staff.
Get a weekly roundup of our market insights
Sign up for our weekly e-mail newsletter.

You Imagine Your Future. We Help You Get There.
Are you ready to start your journey to a better financial future?

Where Might the Market Go Next?
Confidently tackle the market’s ups and downs with independent research and analysis that tells you where we think stocks are headed—and why.
Related Resources
-
Market Analysis On the June Inflation Cooldown2026-07-14
-
Expert Commentary 3 Things You Need to Know This Week | US Inflation, China GDP, US Retail Sales
 2026-07-13
 -
Weekly Wrap-Up Fisher Investments Reviews: Last Week in Markets—July 6 - July 102026-07-13
-
Expert Commentary This Week in Review | Global PMIs, SpaceX, RMD Planning
 2026-07-10


Learn More
Learn why 210,000 clients trust us to manage their money and how Fisher Investments and its affiliates may be able to help you achieve your financial goals.
As of 6/30/2026
New to Fisher? Call Us.
Contact Us Today