Personal Wealth Management / Market Analysis
Wider Credit Spreads Don’t Foretell Stock Meltdown
Credit spreads have widened some, but we don’t think this signals big trouble ahead for stocks.

Oil prices fall more than -20%, and corporate credit spreads widen. Headlines shriek over simultaneous equity market volatility. Is this finally—after nine years—the bull market’s death knell? We don’t think so. We have been to this rodeo before, just a few years ago, and—like then—we don’t think bond yields are signaling the end of this bull. If anything, the feared credit issues seem less acute now than in 2015.
Credit spreads—how much a bond or class of bonds yield over equivalent maturity Treasurys—are a measure of the market’s perception of default risk for corporate debt. Since Treasurys are “risk free”—in the sense few doubt they will be repaid with interest[i]—they provide a good benchmark to evaluate other bonds’ credit risk. The higher the spread, the more the (perceived) credit risk—and the more investors demand extra yield to own it. But many investors watch spreads’ fluctuations for more than that—they see widening spreads as a sign a bear market for equities lurks.
Credit spreads have nudged up in recent weeks, leading many to believe cracks are forming in the economy’s foundations. While widening spreads can hint at cyclical shifts, they are more limited than many financial pundits accept. It isn’t as if bond investors have access to more privileged information than stock investors. All big, similarly liquid markets price information simultaneously, with corporate bonds and stocks sharing many similar drivers.
While bonds mainly react to likely credit events—anything impacting debt payments—and inflation expectations, both stocks and corporate bonds are influenced by earnings’ and revenue expectations. A stockowner theoretically owns a slice of those profits and sales. A corporate bondholder cares because a company with rising sales is likely better able to service its debt. And, because both share similar drivers, stocks and bonds both can be volatile in the near term. Just as stock corrections occur for any or no reason, so can bond yield swings.
Now, spiking yield spreads—a very rapid, sizable jump—could be a sign of troubled credit market conditions, particularly if accompanied by other, fundamental, widespread negatives. This is particularly true of high-yield (or junk bond) credit spreads, which tend to be very sensitive to cyclical economic changes, due to their higher default risk. But the little wiggle since September doesn’t meet that mark.
From September’s end, high yield spreads rose from 3.2 percentage points to 4.3 yesterday—up a relatively pedestrian 1.1 percentage point. As Exhibit 1 shows, this isn’t an unusually big rise and pales next to those preceding recessions. In 2007, they rose rapidly from 2.4 percentage points in June to over 6 percentage points by January 2008. At the crisis’s late-2008 peak, high yield spreads hit 22 percentage points as a wave of defaults spread. Similarly, high-yield spreads spiked prior to 2000’s bear market and subsequent 2001 recession.
Exhibit 1: Credit Spreads Aren’t Alarming
Source: Federal Reserve Bank of St. Louis, as of 11/23/2018. ICE BofAML US Corporate Master Option-Adjusted Spread and ICE BofAML US High Yield Master II Option-Adjusted Spread, 1/2/2007 – 11/20/2018.
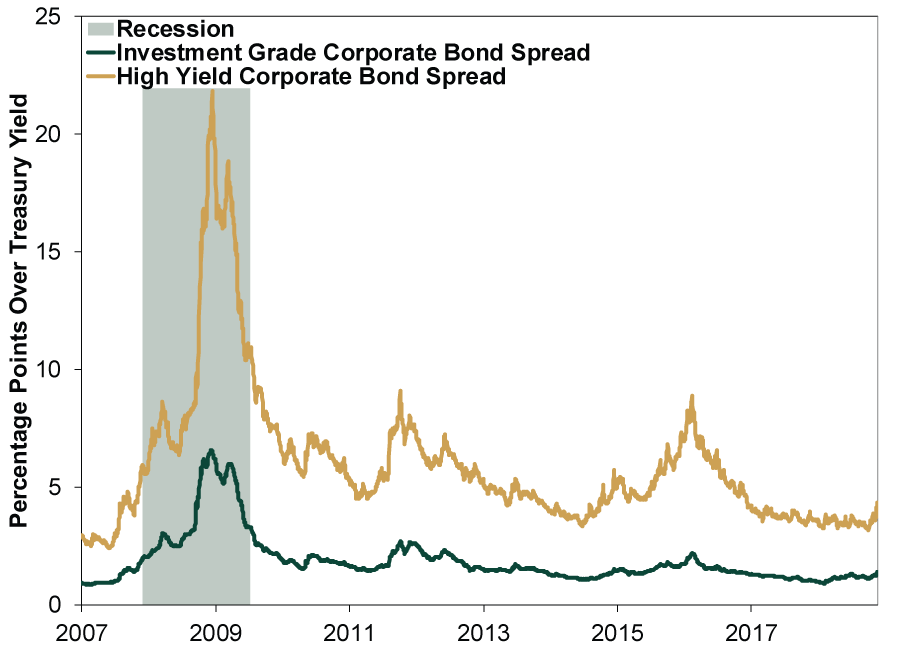
Moreover, spreads aren’t an infallible signal. Over 11 bear markets since 1946,[ii] high yield spreads have a spotty history. They foretold downturns only about a third of the time. More often, spread spikes come too late into a bear to be useful. They can also give false signals, like in 2015 (more below). This doesn’t mean credit spreads should be ignored, but they need greater context to filter out the noise. They should be taken in concert with a wide array of other analytical tools, like forward-looking economic indicators, yield curves and more. And, if trouble really lurks, investment grade corporate spreads—not just high yield—would show the spike, too. While investment grade spreads are up this year, they are only up by 0.4 percentage point. Neither high-yield nor investment-grade spreads are spiking presently, suggesting to us the media narrative here is overblown.
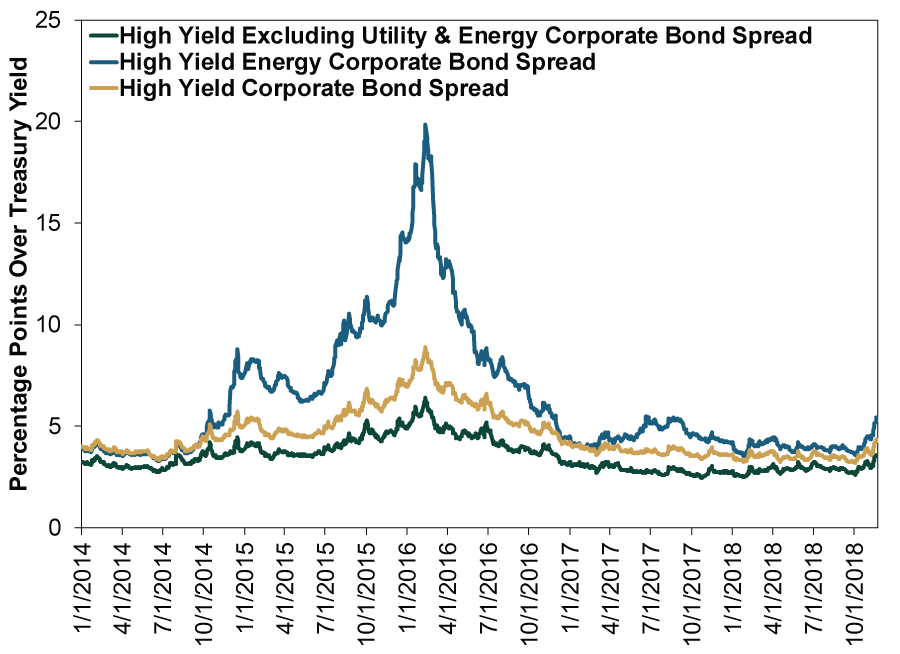
Further, a closer look offers a potential cause that suggests the issue here may be isolated. Exhibit 2 shows the high-yield Energy sector bond spread is leading the rise, up 1.6 percentage points from September to 5.3 yesterday. Excluding Energy and Utilities, high-yield spreads rose just 0.8 percentage point to 3.5.[iii] Falling oil prices lately suggest that worries over renewed Energy sector weakness may be behind spreads’ increase. Now, some suspect oil price declines hint at general economic weakness lurking but, as we discussed here, the same argument persisted from 2014 – 2016 when oil prices plummeted around -75%—far exceeding recent short-term swings.[iv] No macroeconomic or stock market calamity ensued. Then high-yield spreads nearly doubled from under 5 percentage points to almost 10. Energy sector spreads jumped to 20! But excluding Energy (and Utilities), spreads rose from about 3 to a little over 5.
Exhibit 2: Credit Spreads Have Nudged Up
Source: FactSet, as of 11/23/2018. ICE BofAML US High Yield Excluding Utility & Energy Option Adjusted Spread, ICE BofAML US High Yield Energy Option Adjusted Spread and ICE BofAML US High Yield Option Adjusted Spread, 1/1/2014 – 11/22/2018.
For stock investors, the latest credit wrinkle isn’t even close to 2016’s heights, which didn’t signal the end of this bull. It coincided with a correction, which is what we think is afoot once again. Then, as now, rapidly declining Energy prices were a key driver. Gradual credit spread widening to still-tame levels shouldn’t be particularly alarming.
[i] Uncle Sam has a sterling debt payment record—plus the incentive and wherewithal—from which to borrow, thankyouverymuch.
[ii] S&P 500 bear market (peak-to-trough) dates using daily closing price data. They are: 5/29/1946 – 6/13/1949; 8/2/1956 – 10/22/1957; 12/12/1961 – 6/26/1962; 12/12/1961 – 6/26/1962; 11/29/1968 – 5/26/1970; 1/11/1973 – 10/3/1974; 11/28/1980 – 8/12/1982; 8/25/1987 – 12/4/1987; 7/16/1990 – 10/11/1990; 3/24/2000 – 10/9/2002; and 10/9/2007 – 3/9/2009.
[iii] This isn’t strictly comparable to just Energy, but these were the data available and they give you a general idea.
[iv] Source: Federal Reserve Bank of St. Louis, as of 11/20/2018. Crude Oil Prices: West Texas Intermediate (WTI) - Cushing, Oklahoma, 6/20/2014 – 2/11/2016.
If you would like to contact the editors responsible for this article, please message MarketMinder directly.
*The content contained in this article represents only the opinions and viewpoints of the Fisher Investments editorial staff.
Get a weekly roundup of our market insights
Sign up for our weekly e-mail newsletter.

You Imagine Your Future. We Help You Get There.
Are you ready to start your journey to a better financial future?

Where Might the Market Go Next?
Confidently tackle the market’s ups and downs with independent research and analysis that tells you where we think stocks are headed—and why.
Related Resources
-
Economics US Data Stronger Under the Hood Than Many Realize2026-03-16
-
Weekly Wrap-Up Fisher Investments Reviews: Last Week in Markets—March 9 - March 132026-03-16
-
Expert Commentary 3 Things You Need to Know This Week | Fed Meeting, Central Banks, Defense Spending
 2026-03-16
 -
Expert Commentary This Week in Review | Market Volatility, Energy Markets, US Inflation
 2026-03-13


Learn More
Learn why 195,000 clients trust us to manage their money and how Fisher Investments and its affiliates may be able to help you achieve your financial goals.
As of 12/31/2025
New to Fisher? Call Us.
Contact Us Today