Personal Wealth Management / Economics
A Tale of Two Unemployment Surveys
What can we make of October’s employment report?

October’s employment figures are out—at last! And as widely expected, the government shutdown had a huge effect: It delayed the report by 7 days. It impacted the data, too, though, not in the way many expected—job growth trounced expectations. The shutdown merely caused some data discrepancies, which highlight the report’s overall wonky (and, some opine, suspect) construction—illustrating why investors shouldn’t rely on it as their sole gauge of economic or labor market health.
Headlines appear to agree on one thing: The government shutdown didn’t hurt October’s jobs numbers, which showed total non-farm payrolls rising 204,000. Most observers seemed surprised, though we’re a touch unsure why—the shutdown-related furloughs were temporary. Plus, private businesses relying on government contracts are smart enough to know a temporary loss of federal business isn’t reason to permanently cut staff.
While the government shutdown overall didn’t weigh much on payrolls, it did impact the data—it caused some sizeable inconsistencies between the report’s two surveys. The Household Survey (CPS) said total employment dropped by 735,000, confounding the Establishment Survey’s (CES) 204,000 payroll rise. Why the gap? Businesses didn’t report shutdown-related furloughs as payroll losses, but furloughed workers reported themselves as unemployed—which, bizarrely, conforms to both surveys’ guidelines. The CES considered furloughed workers employed since they worked or received pay for the period including the 12th of the month. The CPS considered these same folks unemployed since they weren’t working during the week including the 12th of the month (even though they expected to be recalled). In our view, the CES more accurately reflects labor markets—furloughed workers never really left the labor force.
This isn’t the first time the two surveys’ measures of total employment have differed (Exhibit 1). Over the years, the CPS has proven much more volatile from month to month. This, too, is largely due to the surveys’ differing construction. The CES has a larger data sample, covering about 557,000 businesses. The CPS, by contrast, covers about 60,000 households. As a result, the CES’s overall month-to-month margin of error is considerably lower, less than four times, than the CPS’s—and likely a more accurate gauge of hiring trends. The CPS, on the other hand, is more useful for trends in the labor force.
Exhibit 1: Household Survey vs. Establishment Survey
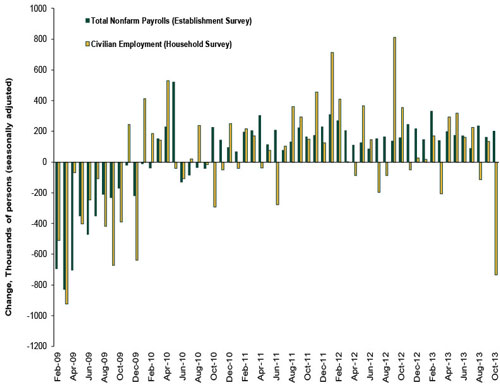
Source: St. Louis Federal Reserve, 2009-2013.
Somewhat less useful is the CPS’s main feature: the headline unemployment rate, which ticked up to 7.3%. Without the furloughs, the employment rate would have been a seasonally adjusted 7.0%—there, too the CPS’s quirks introduced some noise. The unemployment rate’s calculation can be a little tricky during “normal” months, too. It divides the number of out-of-work people who “actively sought” jobs (instead of the number of Americans without work) by the estimated workforce. The “actively sought” part makes this rate dependent on folks’ search habits—or even how they feel on any given day. Hence, looking at this number alone, not the entire data package, could give investors an inaccurate sense of labor market health.
This doesn’t mean the unemployment report should be tossed—just that it should be one of many labor market measures investors use, along with the monthly report on private-sector payrolls from ADP (a private payroll company) or weekly jobless claims. The ISM’s Manufacturing and Non-Manufacturing PMIs also contain employment indexes.
Then, too, employment is a late-lagging indicator. Investors trying to gauge what markets do looking forward should look elsewhere—perhaps to yield curves, corporate balance sheets, certain components of the LEI, the political climate and the regulatory landscape to name a few. All of these (and others) impact corporate earnings on a forward-looking basis—employment data are simply a late confirmation of past growth.
If you would like to contact the editors responsible for this article, please message MarketMinder directly.
*The content contained in this article represents only the opinions and viewpoints of the Fisher Investments editorial staff.
Get a weekly roundup of our market insights
Sign up for our weekly e-mail newsletter.

You Imagine Your Future. We Help You Get There.
Are you ready to start your journey to a better financial future?

Where Might the Market Go Next?
Confidently tackle the market’s ups and downs with independent research and analysis that tells you where we think stocks are headed—and why.
Related Resources
-
Economics Quick Hit: Durably Broad-Based Growth2026-07-29
-
Market Analysis On the Chop in the Oil Market2026-07-29
-
Politics Takaichi Raises Japan’s Wall of Worry2026-07-27
-
In The News Why Kevin Warsh should think twice about hiking interest rates — even as anxiety over the Iran war grows2026-07-27


Learn More
Learn why 210,000 clients trust us to manage their money and how Fisher Investments and its affiliates may be able to help you achieve your financial goals.
As of 6/30/2026
New to Fisher? Call Us.
Contact Us Today