Personal Wealth Management / Market Analysis
Looking for Safety in All the Wrong Places
Despite what terms like “risk assets” and “safe havens” imply, there is no such thing as a riskless investment.

“A risk of loss is involved with investing in stock markets.” No doubt you have seen this sentence (or ones like it) in countless disclosures at the end of financial statements and forecasts. It’s there for legal reasons, but also because it’s true—and critical to remember when making investment decisions. However, it seems few heed it. Instead, investors often seek out perceived “risk-free” assets, despite the fact no asset is “safe.” In our view, pursuing the mirage of “safe” investments can lead to behavioral errors and a portfolio that doesn’t match your long-term goals.
We blame industry jargon for much of investors’ misunderstanding. As analyst-types explain it, markets are “risk on” when investors are happy and willing to take risks, making “risk assets” like stocks zoom. But when markets are “risk off,” jittery folks are plowing into “risk-free” assets like high-quality sovereign debt (e.g., US Treasurys, UK gilts, German bunds and Japanese Government Bonds, aka JGBs), “safe havens” like gold or sectors like Utilities and Telecom.
This might give you the impression stocks are riskier than other assets and some assets are free of risk. This, however, would be wrong. There is no such a thing as a riskless asset. A risk-off investment in allegedly risk-free safe haven assets can still lose money or relative long-term value. Yes, Treasury bonds are typically less volatile than stocks. Likewise, if you’re patient, there is minimal danger of losing principal. If you buy a US bond at issue and hold to maturity, your risk of realizing a loss is basically nil. But you likely lose purchasing power over time due to inflation.
This gets to the root error in the risk-free asset chase—the misperception investment risk refers only to “risk of loss” or the possibility of not getting your principal back. This is one risk, but there are others to consider. Unless an asset is indexed to inflation—a rarity—rising prices eat away at its purchasing power over time. Inflation is modest today, but rock-bottom interest rates mean many low-yielding bonds may experience a negative real rate of return.[i]
If you don’t buy at issue and hold to maturity, you face interest rate risk. Rising rates on equivalent new-issue bonds reduce prices on the secondary market. Consider the bond bear market in the mid-1990s. Between October 15, 1993 and November 7, 1994, 10-year Treasury yields rose from 5.2% to 8.1%.[ii] While higher interest rates can help compensate for price declines, long-term US Treasurys still notched a total return of -9.9% during this stretch.[iii]Then there is the 1970s. 10-year Treasury yields bottomed at 5.4% in March 1971.[iv] They then rose in fits and starts for the next 10 and a half years, peaking at 15.8% in September 1981, a couple months after Fed chair Paul Volcker hiked the fed funds rate one last time to 20%.[v] Higher interest rates helped offset price declines for much of this span, but not the whole time. From June 1980 through September 1981, long-term bonds again had a negative total return at -13.0%.[vi] Oh, and double-digit inflation took a big bite out of those high interest rates’ purchasing power. Today, talk of a great bond bubble—poised to burst and send bond prices plummeting—persists. We disagree with it, but is that a statement you’d expect to accompany a risk-free asset?
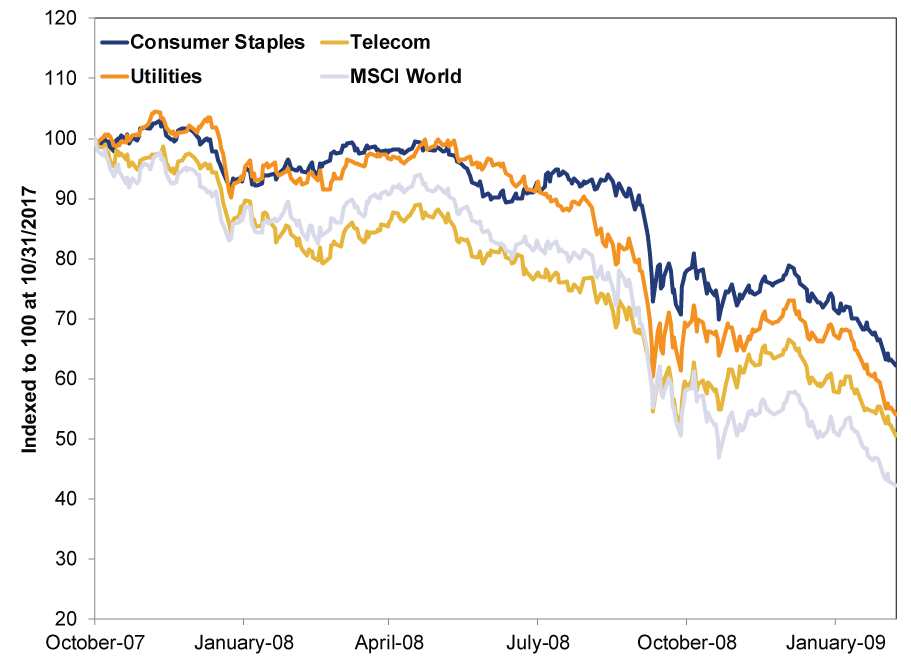
The notion of “safe haven” sectors is also fiction. Certain sectors—especially Consumer Staples, Telecom and Utilities—enjoy a reputation as “defensive” because they often hold up better in economic downturns. And that is a fair point, to an extent. However, they can still fall—an experience that should be foreign to a true safe haven. During the 2008 bear market, these sectors did outperform global stocks’ 58% decline. But as Exhibit 1 shows, they weren’t far behind, plunging 38%, 49% and 46%, respectively.
Exhibit 1: Defensive Sectors Fall, Too
Source: FactSet, as of 12/5/2017. MSCI World Index plus MSCI Consumer Staples, MSCI Telecom, and MSCI Utilities sector returns, all with net dividends, 10/31/2007 – 3/9/2009.
Gold is another popular “safe haven,” despite its history of extreme volatility—higher than stocks’—and failing to rise in tough economic times. Bear markets haven’t regularly been kind to gold, either. Between March 17 and November 13, 2008, a period encompassing the financial crisis’s first 11 months, gold prices fell nearly 30%.[vii] They recovered thereafter, but mostly lagged during the recovery and subsequent expansion. Likewise, during the November 1980 – August 1982 global equity bear market, gold prices sank 47%.[viii] There are only five equity bears since gold began freely trading in 1973. This is a pretty poor record for a supposed crash hedge.
There is no such thing as a free lunch. All securities are volatile. Risk isn’t something you can avoid, full stop. Even cash carries inflation risk. Therefore, reaching any set of long-term financial goals requires taking some risks (volatility) to reduce other risks—like outliving your assets. Understanding how much growth you need to reach your goals is a good first step. Assessing how much volatility you need to reach them over your entire time horizon is step two. Then choose a long-term asset allocation to match and accept that there is no such thing as riskless reward. Instead of chasing the risk-free illusion, try to balance between inevitable risks in a way that maximizes the odds of reaching your goals.
[i] Many sovereign bonds are negative-yielding even before inflation.
[ii] Source: Federal Reserve Bank of St. Louis, as of 12/1/2017. 10-Year Treasury Constant Maturity Rate, 10/15/1993 – 11/7/1994.
[iii] Source: FactSet, as of 12/6/2017. ICE BofA ML US Treasury (7-10y) Index, 10/15/1993 – 11/7/1994.
[iv] Source: Federal Reserve Bank of St. Louis, as of 12/1/2017. 10-Year Treasury Constant Maturity Rate.
[v] Ibid.
[vi] Source: FactSet, as of 12/6/2017. ICE BofA ML US Treasury (7-10y) Index, 6/30/1980 – 9/30/1981.
[vii] Source: Federal Reserve Bank of San Francisco, as of 12/5/2017. Gold Fixing Price (3:00 P.M. London Time), Daily, from 3/17/2008 – 11/13/2008.
[viii] Ibid. Gold Fixing Price (3:00 P.M. London Time), Daily, from 11/20/1980 – 8/12/1982.
If you would like to contact the editors responsible for this article, please message MarketMinder directly.
*The content contained in this article represents only the opinions and viewpoints of the Fisher Investments editorial staff.
Get a weekly roundup of our market insights
Sign up for our weekly e-mail newsletter.

You Imagine Your Future. We Help You Get There.
Are you ready to start your journey to a better financial future?

Where Might the Market Go Next?
Confidently tackle the market’s ups and downs with independent research and analysis that tells you where we think stocks are headed—and why.
Related Resources
-
In The News How investors should think about oil and stocks in the Iran war – in 3 simple steps2026-03-23
-
Weekly Wrap-Up Fisher Investments Reviews: Last Week in Markets—March 16 - March 202026-03-23
-
Expert Commentary PMIs, Denmark Snap Election, Tax Season | 3 Things You Need to Know This Week2026-03-23
-
Market Analysis Why “War Winner” Trades Are Off Base2026-03-20


Learn More
Learn why 195,000 clients trust us to manage their money and how Fisher Investments and its affiliates may be able to help you achieve your financial goals.
As of 12/31/2025
New to Fisher? Call Us.
Contact Us Today