Personal Wealth Management / Market Analysis
Scary Numbers and the Importance of Proper Perspective
Some stats seem scary out of context, but proper perspective often tells a different story.

When volatility strikes, it can seem like bad news is everywhere. Media hype seemingly big numbers, usually with minus signs attached. At times like this, one of an investor’s most important tools is scaling—putting big numbers in context to see whether they are really so meaningful.
Case in point: When volatility escalated recently, headlines bemoaned the Dow’s “biggest one-day point drop ever.” They blamed volatility products for the swings—calling them the “major driver” of market mayhem. Still others fixated on rising wages’ role in sparking inflation fears behind the swoon. These stories feed into folks’ understandable desire to know what is causing market-moving events, more so if they are “record breaking.” But big numbers without context don’t tell you much.
On That Dow Drop
Whenever stocks tumble, most headlines will report the Dow’s daily movement in points. Even though it is a terrible market gauge, it has the most name recognition, and it can throw up some eye-popping numbers. So when it fell -1597 points intraday February 5 and closed down -1175, its worst point decline in history, there was quite a frenzy.[i] But should there have been? As a percentage move, the Dow’s February 5 drop was -4.6%.[ii] But that pales in comparison to October 19, 1987’s “Black Monday” crash, when the Dow plunged -22.6%.[iii] (Keep that in mind when reading the avalanche of 1987 comparisons floating around the internet lately.) But on that day, the Dow fell only -508 points.[iv] It just happened to be much smaller back then, so those 508 points loomed larger. 58 years earlier, it took only -68.9 points in two days to etch the 1929 crash into the history books—a -23% drop.[v]
When confronted with any big number—be it stock index points, debt, financial damage from a natural disaster or what have you—you can gain valuable perspective by turning it into a percentage and seeing if it is really so big compared to the entire size of the market or economy (depending on which is more relevant).
Did Quirky Funds Really Tank the Market?
As volatility spiked, some inverse-volatility products—funds designed to move inversely to the VIX, often using leverage—imploded. Because of their huge declines, some suspect they “caused” the Dow’s sharp afternoon plunge on February 5. As the theory goes, to cover their bets at day’s end, the funds’ traders would have had to buy more VIX futures or short stocks, and this scramble to rebalance reverberated through the stock market. Perhaps, but the two funds in question amounted to $3.7 billion at January’s end. Although for many this sounds like a lot, it amounts to a single small-cap stock. The median S&P 500 company’s market cap is about $22.5 billion.[vi] The whole index had an aggregate $25.3 trillion market cap on January 31.[vii] Before they imploded, these products were only 0.015% of that. Even if the chain of events played out exactly as theorized, we think it is a stretch to say trading related to $3.7 billion worth of investment products drove over a trillion dollar decline in S&P 500 market cap that day. It is much more likely a side story—an effect!—than direct cause.
Were Those Wage Gains Really So Big?
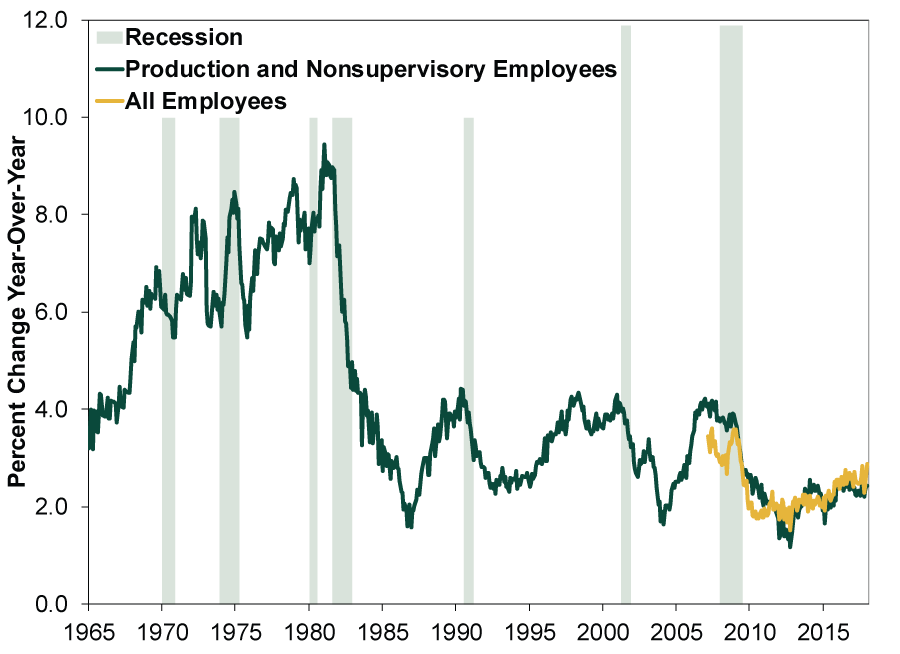
As we discussed in more depth last week, one purported correction “cause” was a freakout over January’s nonfarm payroll report, which revealed 2.9% y/y wage increases—the largest in nine years—fueling inflation fears.[viii] Setting aside the fact wages don’t drive inflation, scaling reveals January’s jump wasn’t so big. 2.9% y/y may be the biggest increase during this expansion, but for years, folks have bemoaned this cycle’s unusually slow wage growth, so the real question is: Is 2.9% fast compared to history? Before the economic recovery began in July 2009, average monthly wage growth for production and nonsupervisory employees—a much longer dataset—was 4.6% y/y.[ix] January’s 2.4% y/y read for that series was little more than half that.[x] Not so big. (Exhibit 1) And the headline wage growth (yellow line) that generated all the hoopla? Still well below levels seen during the small portion of the last expansion that this series existed. Putting the narrative in context also helps. For years, folks lamented low wage growth. Now that it is finally accelerating, you would think it would bring some relief, even cheer. The fear that materialized instead is a sign of unwarranted skepticism, in our view.
Exhibit 1: Average Hourly Earnings
Source: Federal Reserve Bank of St. Louis, as of 2/13/2018. Average hourly earnings of production and nonsupervisory employees: Total private, January 1965 – January 2018, and average hourly earnings of all employees: Total private, March 2007 – January 2018.
[i] Source: The Wall Street Journal, as of 2/14/2018. Dow Jones Industrial Average, 2/5/2018.
[ii] Ibid.
[iii] Ibid. Dow Jones Industrial Average, 10/19/1987.
[iv] Ibid.
[v] Source: Dow Jones Indexes, as of 9/30/2008. Dow Jones Industrial Average, 10/28/1929 – 10/29/1929.
[vi] Source: S&P Dow Jones Indices, as of 2/14/2018. S&P 500 median total market capitalization, 1/31/2018.
[vii] Ibid. S&P 500 total market capitalization, 1/31/2018.
[viii] Source: Bureau of Labor Statistics, as of 2/2/2018. Average hourly earnings of all employees: Total private, January 2018.
[ix] Source: Federal Reserve Bank of St. Louis, as of 2/14/2018. Average hourly earnings of production and nonsupervisory employees: Total private, January 1965 – July 2009.
[x] Source: Bureau of Labor Statistics, as of 2/2/2018. Average hourly earnings of production and nonsupervisory employees: Total private, January 2018.
If you would like to contact the editors responsible for this article, please message MarketMinder directly.
*The content contained in this article represents only the opinions and viewpoints of the Fisher Investments editorial staff.
Get a weekly roundup of our market insights
Sign up for our weekly e-mail newsletter.

You Imagine Your Future. We Help You Get There.
Are you ready to start your journey to a better financial future?

Where Might the Market Go Next?
Confidently tackle the market’s ups and downs with independent research and analysis that tells you where we think stocks are headed—and why.
Related Resources
-
Market Analysis Will Lower Capital Requirements Send Banks Higher?2026-03-26
-
Politics This Week in Gridlock: Europe Edition2026-03-26
-
Expert Commentary Ken Fisher on Measuring Inflation, Currency Reset, Commodities, and more2026-03-25
-
Interesting Market History Six Years On, Lessons From the COVID-Lockdown Low Endure2026-03-25


Learn More
Learn why 195,000 clients trust us to manage their money and how Fisher Investments and its affiliates may be able to help you achieve your financial goals.
As of 12/31/2025
New to Fisher? Call Us.
Contact Us Today