Personal Wealth Management / Market Analysis
Talking About 2018 Trade
The trade deficit isn’t an economically meaningful statistic. Total trade is—and it had a fine 2018.

A shutdown-delayed data release showed the US trade deficit rose 18.8% m/m in December to $59.7 billion, the largest gap since October 2008.[i] For all of 2018, the deficit rose 12.5%—also landing at a 10-year high—while the goods trade deficit reached an all-time record.[ii] The figures spurred much politicized chatter, but we don’t think they signal anything concerning about the US economy or stocks.
The trade deficit garners way more attention than it deserves, in our view, as it is a meaningless statistic. Whether rising or falling, it doesn’t reveal useful information about the economy’s health. It also creates confusion. Contrary to what the name implies, the trade deficit doesn’t reflect a growing sum the US must repay or the hollowing out of domestic industry. Rather, it is the result of individual Americans’ opting to buy more goods and services from international sellers than individuals elsewhere opt to buy from the US. These transactions create no obligations. The fact they occur across international borders doesn’t change this. No one worries about the consequences of New Yorkers purchasing more from Virginians than the reverse.
The record goods trade gap is also natural considering the US has evolved over time into a services-driven economy, with a manufacturing sector focused on high-tech machinery. Conversely, some countries overseas tend to focus more on the cheaper consumer goods Americans gobble up. In other words, the goods trade deficit is a sign of specialization. It shows consumers’ and businesses’ collective buying and selling decisions are allocating resources to each country’s economic strong suits—a marker of efficiency, not imbalance.
While many fret the “loss” of money sent abroad to pay for imports, it returns in the form of investment, be it in US businesses or government debt. The US’s position as a pre-eminent investment destination is reason for cheer, not fear—and rather than driving up the national debt, foreign Treasury purchases provide another source of demand, helping keep Treasury yields in check. The notion high trade deficits are job killers doesn’t hold up, either. Again, growing deficits generally coincide with expansions—when employment tends to rise. Recent history confirms this: As the trade deficit rose last year, employment did too, by 1.9%.[iii] The unemployment rate hovered around 4%, and many workers who had given up seeking work—and were therefore omitted from official workforce measures—started looking anew.[iv]
If anything, falling trade deficits can signal trouble, as they may indicate flagging US demand. This is why trade deficits tend to fall during recessions. In 2009, the US trade deficit fell a whopping -46%.[v] In 2001, it fell just -3%—but this came after three years of ~50% growth.[vi] To us, rooting for smaller deficits seems perverse.
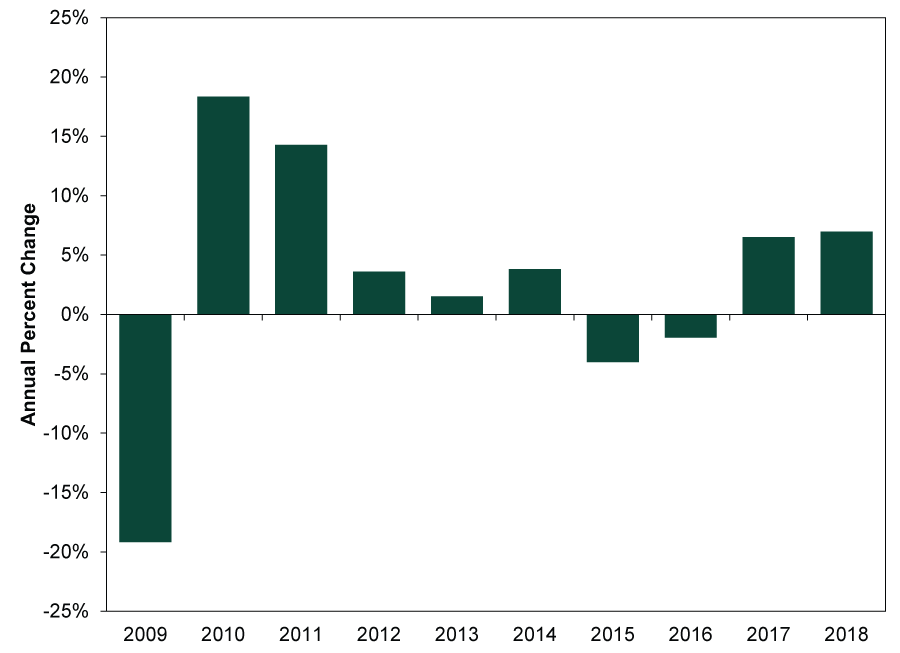
In our view, total trade is more meaningful because it treats both exports and imports as the economic positives they are. This measure paints a much better picture of US trade in 2018. Total trade rose 7.0% for the year, its fastest pace since 2011.[vii] Imports (up 7.5%) and exports (6.3%) both reflect growth.[viii] The latter show US products and services are in high demand elsewhere—good. The former show US consumers (and businesses, which import inputs used to make final products) are willing and able to spend—also good!
While total trade is telling, occasional softness doesn’t automatically derail growth. As Exhibit 1 shows, US trade had a rough patch in 2015 – 2016, as exports decelerated sharply tied to a commodity-led global trade pullback. But this didn’t send the US economy into a tailspin. GDP kept growing—2.9% in 2015 and 1.6% in 2016.[ix] Trade is a nice plus, but the US economy is diverse. Domestic demand can often pick up the slack.
Exhibit 1: Annual Growth in Total US Trade
Source: US Bureau of Economic Analysis, as of 3/7/2019.
Rising trade in 2018 wasn’t a US-only phenomenon: Global goods trade grew 3.3% for the full year.[x] However, US exports weakened toward last year’s end, contracting on a month-over-month basis throughout Q4.[xi] Many blame tariffs—and indeed, they likely played some role. Importing firms may have frontloaded orders ahead of tariffs’ taking effect last year. The export dip could also reflect weaker demand from China’s private firms, which knocked trade in Europe and Asia as well.
We think these causes should be fleeting, however. As firms’ inventories of key imported production inputs run low, orders probably pick up again—particularly since tariffs are generally easy to skirt. Another potential boost: China ramping up stimulus to counter the effects of its crackdown on shadow lending. This likely helps demand from China’s vast private sector rebound, fueling spending on US and European goods and services. But even if late 2018’s trade weakness persists, this expansion has already shown it can weather such periods. Meanwhile, persistent tariff fears lower expectations, raising the probability even modest export growth surprises. Trade deficit misconceptions probably aren’t going away anytime soon, but that needn’t stop total trade from contributing to the still-solid US and global economic expansions.
[i] Source: US Bureau of Economic Analysis, as of 3/7/2019.
[ii] Ibid.
[iii] Source: Federal Reserve Bank of St. Louis, as of 3/7/2019. Annual percent change in US Total Nonfarm Payrolls in 2018.
[iv] Ibid. Statement based on the Monthly US Civilian Unemployment Rate, January 2018 – December 2018.
[v] Source: US Bureau of Economic Analysis, as of 3/7/2019
[vi] Ibid.
[vii] Ibid.
[viii] Ibid.
[ix] Source: FactSet, as of 3/7/2019.
[x] Source: FactSet, as of 3/8/2019. Foreign trade volume, world, annual percentage change in 2018.
[xi] Source: US Bureau of Economic Analysis, as of 3/7/2019.
If you would like to contact the editors responsible for this article, please message MarketMinder directly.
*The content contained in this article represents only the opinions and viewpoints of the Fisher Investments editorial staff.
Get a weekly roundup of our market insights
Sign up for our weekly e-mail newsletter.

You Imagine Your Future. We Help You Get There.
Are you ready to start your journey to a better financial future?

Where Might the Market Go Next?
Confidently tackle the market’s ups and downs with independent research and analysis that tells you where we think stocks are headed—and why.
Related Resources
-
Market Analysis Why “War Winner” Trades Are Off Base2026-03-20
-
Expert Commentary This Week in Review | Energy Markets, Fed Meeting, Earnings Reporting
 2026-03-20
 -
Market Analysis Around the World in Central Banking, Iran War Edition2026-03-19
-
Politics Beyond the War: A Political Roundup Covering America, Canada and Denmark2026-03-17


Learn More
Learn why 195,000 clients trust us to manage their money and how Fisher Investments and its affiliates may be able to help you achieve your financial goals.
As of 12/31/2025
New to Fisher? Call Us.
Contact Us Today