Personal Wealth Management / Market Analysis
US Debt Isn’t Out of Control
Though higher, in our view, US debt is nowhere near dangerous levels and no threat to this bull market.

By most accounts, the US economy is humming along. But some worry today’s low unemployment and strong economic growth are merely a sugar high—the product of tax cuts and big spending, which are combining to send national debt surging to dangerous levels. Last week’s Fed rate hike has also raised the specter of high and rising interest payments, spurring fears the US government is on an unsustainable fiscal path. But we are unconvinced. Even as it sets new records, US debt isn’t growing at an unusually rapid pace today—and forecasts for an inevitable debt reckoning down the road are hugely premature, in our view.
At last count, US national debt stood at $21.2 trillion after growing 6.8% y/y in Q2.[i] Strip out intra-governmental holdings—basically, money the government owes itself—to get net public debt of $15.5 trillion (up 7.7% y/y in Q2).[ii] A monthly Treasury report showing August’s budget deficit reached $107.7 billion also fueled debt fears: Adjusting for some calendar quirks, August’s total was 41% higher than a year ago, with a 30% y/y rise in outlays the main contributor.[iii] A recent CBO report seemingly piled on, noting that in the present fiscal year’s first 11 months, net interest on debt held by the public rose 19%.[iv] The CBO went on to warn the national debt’s current trajectory will push federal interest costs up to 17% of tax revenues and 13% of the overall budget in 2028—up from and 8% and 7% in 2017, respectively. This, many claim, will be a heavy burden. But in our view, it is a distant hypothetical, as debt projections typically are.
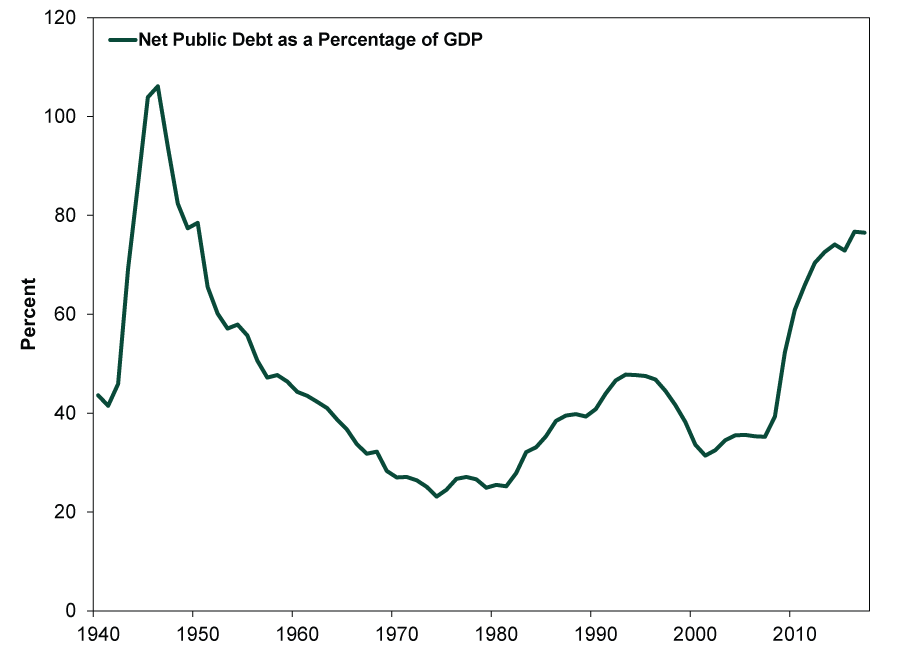
$21.2 trillion is a lot. So is $15.5 trillion. But with some context, present debt doesn’t appear quite so menacing. First, per Exhibit 1, net public debt isn’t astronomical as a percentage of GDP.[v]
Exhibit 1: Net Public Debt as a Share of GDP
Source: Office of Management and Budget, as of 10/1/2018. Net public debt as a percentage of US GDP, 1940 – 2017.
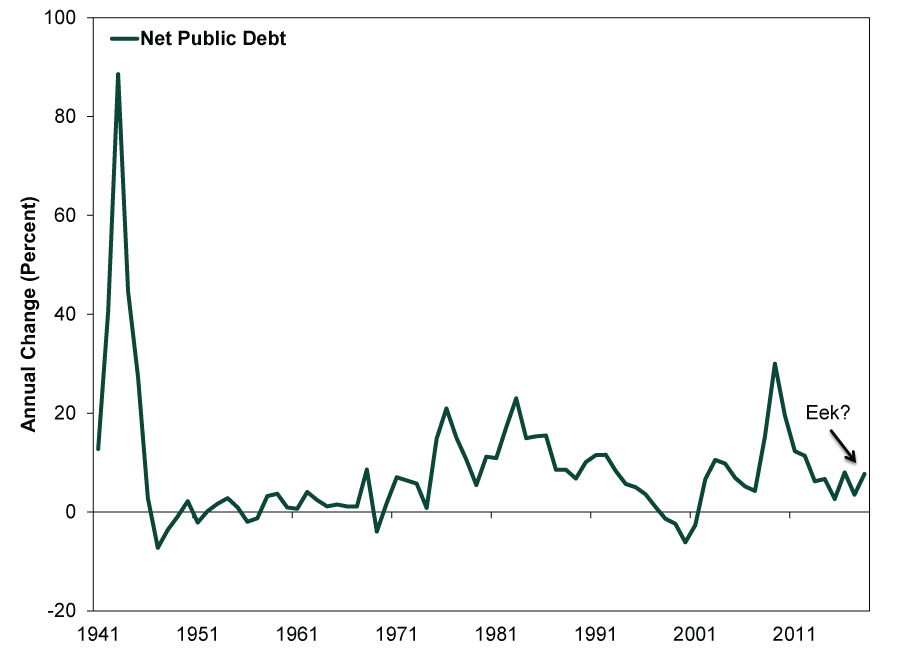
Plus, debt isn’t rising far faster than usual. As Exhibit 2 shows, net public debt’s 7.7% y/y increase in Q2 is well below the financial-crisis era pace of 20% – 35%. It is also slower than much of the 1980s and early 1990s.[vi] During these (generally prosperous) times, holders of American debt didn’t flee in terror as the sum rose. Interest rates on 10-year Treasurys fell overall during this period.
Exhibit 2: Net Public Debt Isn’t Growing That Fast
Source: Office of Management and Budget, as of 10/3/2018. Annual percent change in net public debt, 1941 – 2018. The 2018 figure is an estimate based on projections of full-year federal spending and revenues. Only Q1 and Q2 spending and revenue levels have been recorded so far.
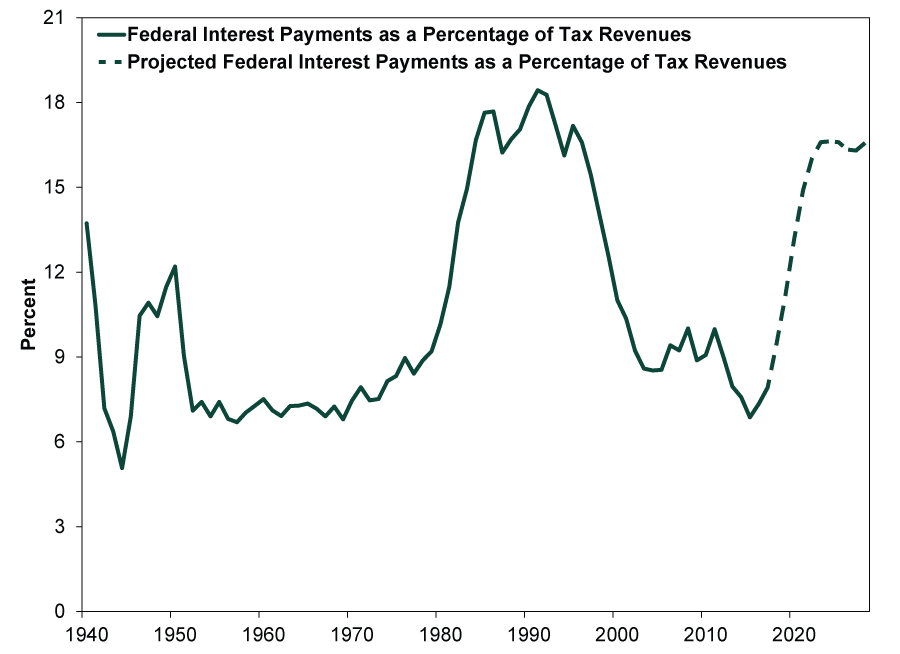
US interest payments also remain quite low by historical standards, compared to both federal spending and tax receipts. (Exhibits 3 and 4 show US interest payment history in green and CBO projections for future growth in yellow.) National debt becomes a problem only when countries struggle to service it—and servicing Treasurys is currently a breeze.
Exhibit 3: Interest Payments as a Share of Spending
Sources: Federal Reserve Bank of St. Louis and the Congressional Budget Office (CBO), as of 10/3/2018. Annual interest outlays on Federal debt divided by total Federal outlays, 1940 – 2017, plus CBO projections for 2018 – 2028 (dotted line). CBO projections aren’t hugely reliable.
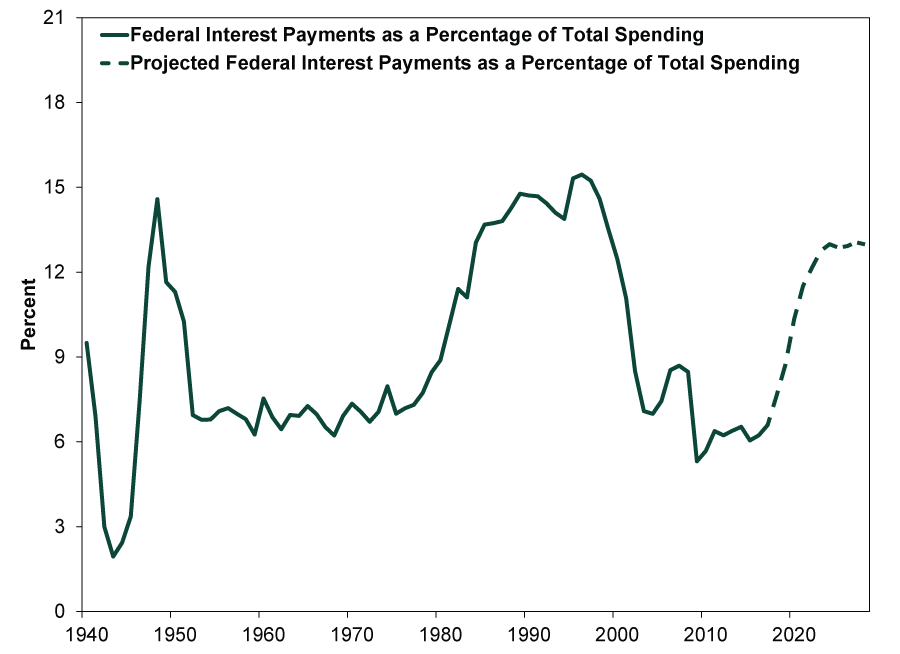
Exhibit 4: Interest Payments as a Share of Tax Revenues
Sources: Federal Reserve Bank of St. Louis and the Congressional Budget Office, as of 10/3/2018. Annual interest outlays on Federal debt divided by Federal tax receipts, 1940 – 2017, plus CBO projections for 2018 – 2028 (dotted line). CBO projections aren’t hugely reliable.
Most acknowledge debt isn’t an issue today but fear rising rates (tied to Fed hikes) could change that. Yet Fed hikes affect only overnight rates. Long rates—which govern most US debt—are a market function. And since most federal debt is fixed rate, interest rate fluctuations matter only to the extent they affect newly issued debt. The average weighted maturity of US debt is 69.5 months—it would take many years for the bulk of it to roll over at (hypothetical) higher rates.[vii] Interest rates would likely have to spike and remain high for costs to surge.
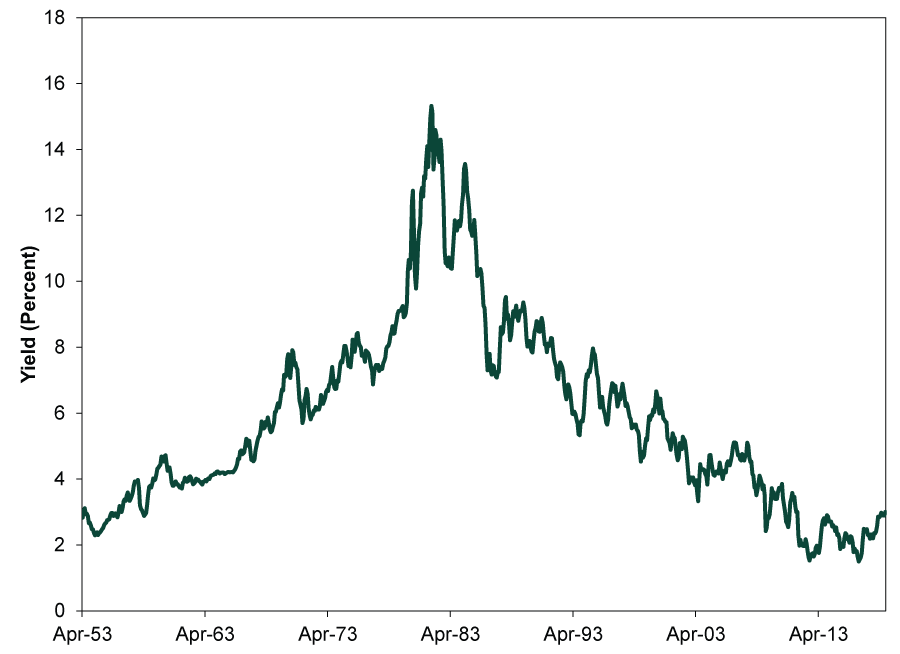
Despite bigger budget deficits, long rates have wiggled just a smidge this year and remain near generational lows. (Exhibit 5) In order for long-term rates to surge, inflation—a key driver of long rates—would likely have to leap higher and remain elevated for some time. But there is little sign of this presently.
Exhibit 5: 10-Year US Treasury Rate
Source: Federal Reserve Bank of St. Louis, as of 10/1/2018. 10-year US Treasury yield (constant maturity), April 1953 – September 2018.
Long-term catastrophe isn’t guaranteed, either. The dire scenarios headlines frequently feature hinge on straight-line forecasts, which are unreliable. For instance, the CBO’s projections of interest payments reaching 13% of federal spending and 17% of tax receipts in a decade—levels exceeded for good chunks of the 1980s and 1990s, as Exhibits 3 and 4 show—mostly just extrapolate recent trends forward. History shows this approach’s folly. In 2003, using recent spending and revenue trends, the CBO anticipated hefty budget surpluses in 2013. The agency’s long-term forecasts for GDP and inflation have proven similarly inaccurate.
We aren’t here to pick on the CBO or its methods. Long-term forecasting is tough, and baking in assumptions about how present trends might change—a common corrective approach—is equally error-prone. Consider the following ways today’s trends could shift:
- Interest rates could stay flat—or fall. Contrary to a common belief, higher debt doesn’t automatically drive up rates, as the last couple decades of rising debt and mostly falling or flat long-term rates illustrate.
- Growth—and tax revenue—could pick up.
- Spending could fall as fiscal policies and priorities change.
Those watching recent spending and deficit patterns might reply, “fat chance!” to each of these. But “recent” is the operative word—and recent trends aren’t necessarily predictive.
Lastly, markets focus on nearer-term risks—typically over the next 3 – 30 (or so) months—and we don’t believe US national debt is one of them. This isn’t to say high spending is always good or that debt can never pose issues. Excessive government spending can crowd out private sector investment and financing while raising the likelihood of painful cutbacks when Congress tightens the purse strings. Markets also heed distressed countries’ ability to service debt. But the US doesn’t appear remotely close to the danger zone today. Hence, we expect stocks will focus elsewhere as this bull market keeps chugging along.[i] Source: Federal Reserve Bank of St. Louis, as of 9/27/2018.
[ii] Ibid.
[iii] “U.S. Budget Deficit Widened in August, Treasury Says,” Kate Davidson, The Wall Street Journal, 9/13/2018.
[iv] “Monthly Budget Review for August 2018,” Congressional Budget Office, 9/10/2018.
[v] This comparison isn’t perfect, as debt is a level and GDP is a flow—apples and oranges. But it is a common way to scale national debt, so it still counts as context.
[vi] Source: Federal Reserve Bank of St. Louis, as of 10/1/2018.
[vii] “Treasury Presentation to TBAC for Fiscal Year 2018 Q3,” Office of Debt Management at the US Treasury, accessed 9/27/2018.
If you would like to contact the editors responsible for this article, please message MarketMinder directly.
*The content contained in this article represents only the opinions and viewpoints of the Fisher Investments editorial staff.
Get a weekly roundup of our market insights
Sign up for our weekly e-mail newsletter.

You Imagine Your Future. We Help You Get There.
Are you ready to start your journey to a better financial future?

Where Might the Market Go Next?
Confidently tackle the market’s ups and downs with independent research and analysis that tells you where we think stocks are headed—and why.
Related Resources
-
Economics A May Global Economic Check-In2026-05-26
-
Weekly Wrap-Up Fisher Investments Reviews: Last Week in Markets—May 18 - May 222026-05-26
-
In The News How to think about the Iran war — and what it means for oil and stocks2026-05-25
-
Expert Commentary 3 Things You Need to Know This Week | US Inflation, US Q1 GDP, Graduation Season
 2026-05-25


Learn More
Learn why 200,000 clients trust us to manage their money and how Fisher Investments and its affiliates may be able to help you achieve your financial goals.
As of 3/31/2026
New to Fisher? Call Us.
Contact Us Today