Personal Wealth Management / Market Analysis
A Data Snapshot as Winter Wound Down
A look at some widely watched data before the financial sector’s turbulence.

What are the economic implications of this month’s regional bank scare? Speculation abounds, but the latest lending data—which we covered here—suggest US banks didn’t turn ultra conservative and cease lending. Alongside those weekly numbers, several monthly economic indicators came out last Friday. These reports won’t capture March’s financial sector ripples. But the data suggest that, entering this period, developed economies were faring considerably better than expectations from the start of the year.
March Flash PMIs: A Services Story
Major developed economies grew in March, according to S&P Global’s flash purchasing managers’ indexes (PMIs). PMIs are monthly business surveys where readings above 50 imply expansion and below 50 suggest contraction. The broad takeaway from March: Services drove growth while manufacturing contracted. (Exhibit 1)
Exhibit 1: The Latest PMIs
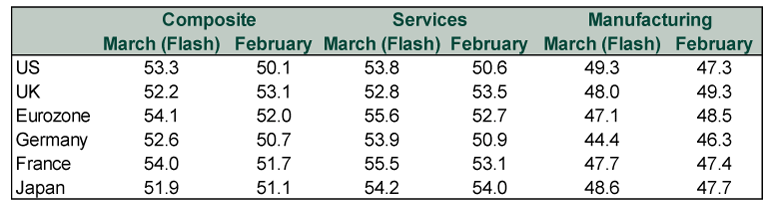
Source: S&P Global, as of 3/24/2023. US readings differ from the Institute for Supply Management’s separate series.
Services firms in America and the UK reported improving domestic demand while Japanese services benefited from a tourism boost tied to China’s eased COVID restrictions.[i] On the Continent, services growth wasn’t restricted to just the largest economies, Germany and France. As S&P Global noted, “It was the rest of the eurozone as a whole that again reported the strongest performance, the composite index up from 53.4 to an 11-month high of 55.5. Services activity surged higher at a rate not seen since November 2021 and manufacturers reported a modest upturn in production for a second successive month.”
Things weren’t as rosy on the manufacturing side. Firms from reporting nations noted weaker demand, with activity tied largely to the fulfillment of order backlogs post-pandemic.[ii] Looking ahead, manufacturing weakness may linger as new orders—which reflect future production—continued contracting in March (e.g., US new orders have fallen for six straight months). [iii]
In our view, the latest flash PMIs reinforce a well-known reality: Global economic growth is mixed. Take manufacturing’s struggles, which aren’t new. In the past six reported months, manufacturing output contracted three times in the US, Japan and eurozone—and four times in the UK.[iv] Now, we don’t dismiss the possibility slowing factory activity tips some nations into recession. Europe’s energy supply issues, for example, have weighed on Germany’s economy—though markets have likely pre-priced much of that impact already, in our view. Though manufacturing’s struggles are a headwind for the global economy, they won’t necessarily impede growth. Since services drive the lion’s share of economic output in developed nations, growth in that sector can support global expansion, in our view.[v]
On UK Retail Sales’ Strong February
UK February retail sales volumes rose 1.2% m/m, its biggest monthly gain since last October.[vi] Since the Office for National Statistics adjusts the series for inflation, last month’s growth indicates consumers spent despite elevated prices. But some observers added caveats to February’s strength, highlighting higher sales at discount and second-hand goods shops (e.g., auction houses and charity shops) as well as food stores—with the latter suggesting consumers were trying to save by eating at home instead of at restaurants. The implication: Sure, consumers are spending, but only selectively because of cost-of-living pressures.
In our view, this is a case of the consensus applying inconsistent logic to retail sales volumes. Last year, many fretted over the divergence between sales values and volumes, bemoaning the loss of consumers’ purchasing power due to higher prices. (Exhibit 2) Now pundits appear concerned retailers’ discounting is boosting sales volumes—seemingly overlooking the fact that discounting means consumers are regaining purchasing power. You can’t have it both ways, in our view.
Exhibit 2: The Divergence in UK Retail Sales
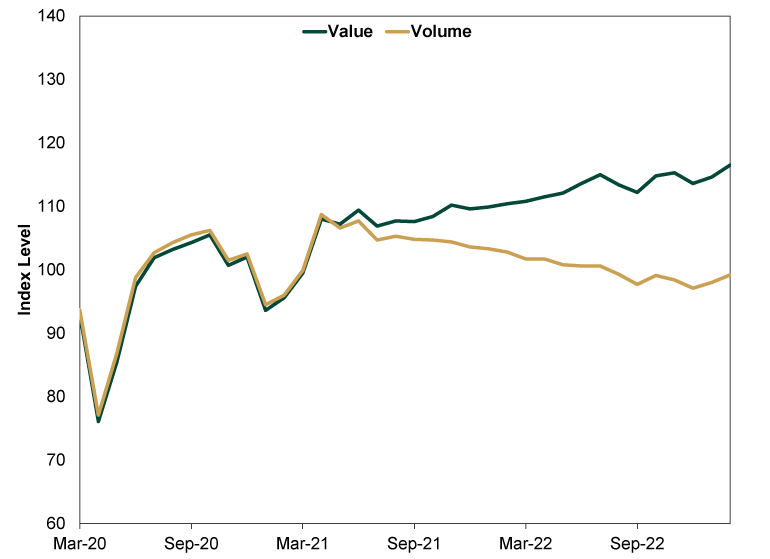
Source: Office for National Statistics, as of 3/24/2023.
One month doesn’t make a trend, but February’s growth reinforces the notion consumer spending is resilient even amid challenging economic conditions.
What Are “Core” Capital Goods Orders Saying?
US durable goods orders fell -1.0% m/m in February, missing expectations for 1.0% growth.[vii] But many focus on core capital goods orders (which exclude volatile defense and aircraft orders), widely considered to be a leading indicator of business investment since it reflects equipment spending—one component of the broader category. This subset rose 0.2% m/m, its second straight rise following two monthly contractions.[viii]
Looking more broadly, core capital goods orders, which aren’t adjusted for inflation, have mostly shot higher since the economy reopened—perhaps partially reflecting elevated prices over the past two years. But orders have slowed in recent months, which may signal some easing demand.
Exhibit 3: US Core Capital Goods Orders, December 2019 – February 2023
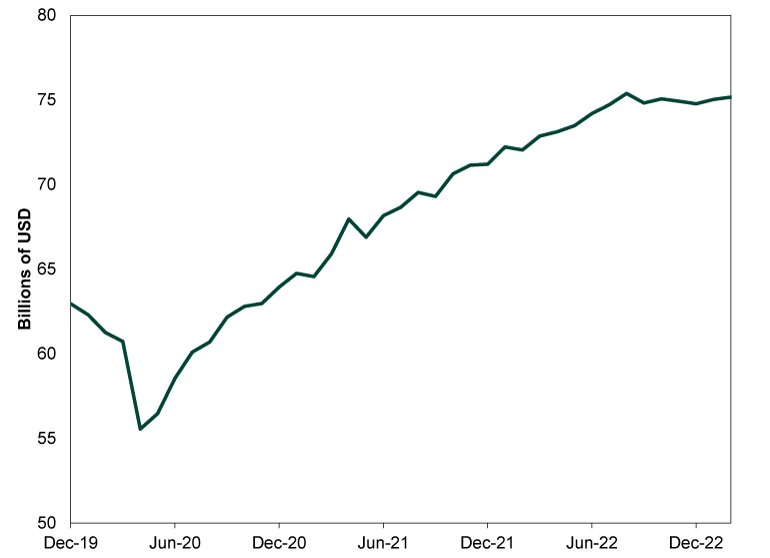
Source: FactSet, as of 3/27/2023.
Concerns about flagging business investment are understandable, as the category is often recession’s swing factor, and weakening equipment expenditures could detract from GDP. But equipment spending comprises about 40% of total business investment, and core capital goods orders don’t reflect investment in structures or intellectual property (e.g., research & development).[ix]
Consider: Q4 US GDP grew 2.7% annualized despite equipment investment’s -0.17 percentage point detraction.[x] Moreover, that contraction didn’t prevent business investment from contributing 0.43 percentage point to growth.[xi] Structures added 0.21 percentage point while intellectual property products contributed 0.39 percentage point—offsetting equipment’s dip.[xii] Of course, a slowdown in capital goods spending or US recession remain possible, but the data don’t confirm a downturn is inevitable, either.
[i] Source: S&P Global, as of 3/27/2023.
[ii] Ibid.
[iii] Ibid.
[iv] Source: FactSet, as of 3/24/2023. Statement based on monthly change in manufacturing component of industrial production through February 2023 for the US, January 2023 for the UK and Japan, and December 2022 for the eurozone.
[v] Source: The World Bank, as of 3/27/2023. Statement based on value added of services sector as a percentage of GDP. For the US, 77.6% (as of 2021); UK, 71.5% (as of 2021); eurozone 65.7% (as of 2021) and Japan 69.5% (as of 2020).
[vi] Source: Office for National Statistics, as of 3/27/2023.
[vii] Source: FactSet, as of 3/27/2023.
[viii] Ibid.
[ix] Source: Bureau of Economic Analysis, as of 3/27/2023.
[x] Ibid.
[xi] Ibid.
[xii] Ibid.
If you would like to contact the editors responsible for this article, please message MarketMinder directly.
*The content contained in this article represents only the opinions and viewpoints of the Fisher Investments editorial staff.
Get a weekly roundup of our market insights
Sign up for our weekly e-mail newsletter.

You Imagine Your Future. We Help You Get There.
Are you ready to start your journey to a better financial future?

Where Might the Market Go Next?
Confidently tackle the market’s ups and downs with independent research and analysis that tells you where we think stocks are headed—and why.
Related Resources
-
Market Analysis Why “War Winner” Trades Are Off Base2026-03-20
-
Expert Commentary This Week in Review | Energy Markets, Fed Meeting, Earnings Reporting
 2026-03-20
 -
Market Analysis Around the World in Central Banking, Iran War Edition2026-03-19
-
Politics Beyond the War: A Political Roundup Covering America, Canada and Denmark2026-03-17


Learn More
Learn why 195,000 clients trust us to manage their money and how Fisher Investments and its affiliates may be able to help you achieve your financial goals.
As of 12/31/2025
New to Fisher? Call Us.
Contact Us Today