Personal Wealth Management / Market Analysis
Don’t Fear the Death Cross
Unless followed, death crosses pose little threat to your portfolio’s long-term performance.

The event stock market observers spent days watching for finally occurred on Friday: The S&P 500 Index formed a “death cross,” a technical indicator allegedly indicating dark times ahead (as the name implies). Like its cousin, the colorfully named Hindenburg Omen, the death cross purports to predict a market crash. Yet a quick look at market history shows the death cross isn’t a reliable predictor—no technical indicator is. Investors following it are likely led astray.
A death cross occurs when a stock’s or index’s 50-day moving average crosses below the 200-day average. Supposedly, this marks a downturn gaining steam, signaling further trouble. As recent headlines heralding this intersection attest, the financial media likes to play up death crosses—the ominous name gets clicks and eyeballs. A 50-day’s move below the 200-day by definition happens during pullbacks—when folks are often nervous.
But the death cross is a poor tool, in our view. It is true a death cross generally occurs early in a bear market. But death crosses happen many other times, too. As Exhibit 1 shows, the last four death crosses happened in January 2016, August 2015, August 2011 and July 2010. All these occurred well into corrections. Acting on them would have realized losses and positioned you to miss the rebound—not a great strategy for reaping stocks’ long-term returns.
Exhibit 1: Batting One Out of Seven Since 2004
Source: Global Financial Data, Inc. and Federal Reserve Bank of St. Louis, as of 12/10/2018. S&P 500 Price Index, 1/2/2004 – 12/7/2018.
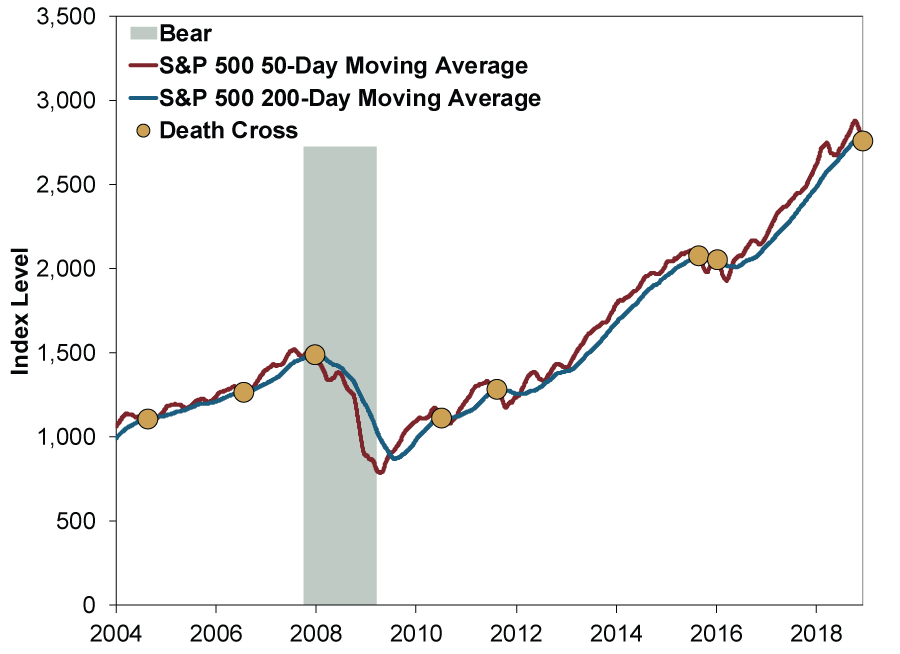
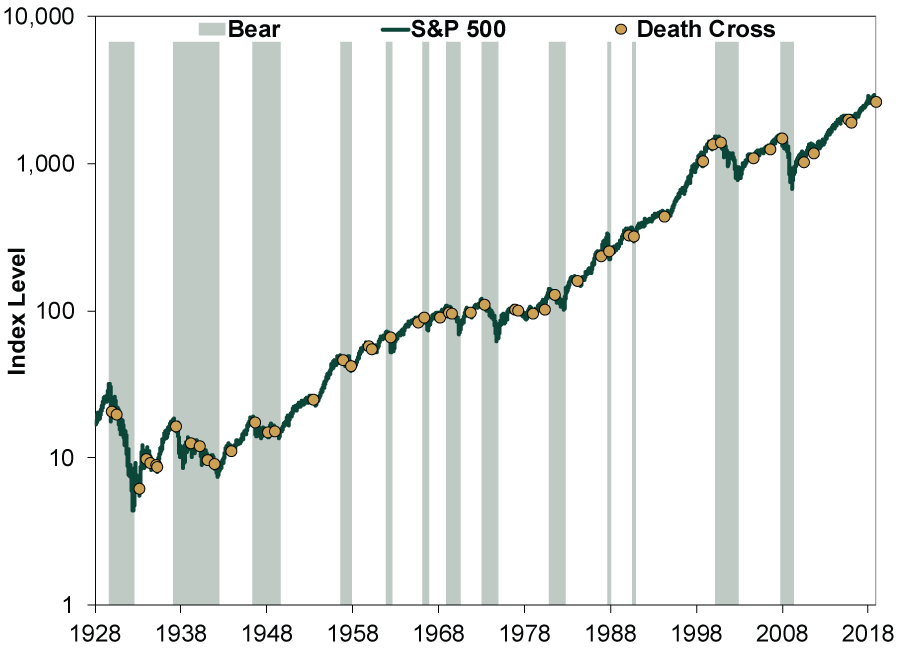
A technician might suggest they could buy back in when the 50-day crosses back above the 200-day (a “golden cross”), but in all those cases, it would have been at a higher price—a losing trade. The same with 2004 and 2006. Exhibit 2 shows 51 death crosses since 1928, when daily S&P 500 data begin. Less than a third occurred as a bear market was forming. The other times, a death-cross-following investor would have watched stocks rise not long after they sold.
Exhibit 2: Death Crosses Mostly Lead Astray
Source: Global Financial Data, Inc. and Federal Reserve Bank of St. Louis, as of 12/10/2018. S&P 500 Price Index, 1/3/1928 – 12/7/2018.
The death cross’s historical inaccuracy stems from a simple point: Like all technical indicators, it reflects past performance. Backward-looking! Yet stocks aren’t serially correlated, meaning yesterday’s movement has no bearing on today’s or tomorrow’s. Investors must look forward and consider the fundamental backdrop since that is what markets do, too. Gauge the economic and political outlook. Then, considering markets usually pre-price widely known and discussed information, assess what markets currently reflect. Does it match the fundamentals you expect? If not, is reality more likely to positively or negatively surprise investors?
That—how reality compares to expectations—is what drives markets, not past performance and the price patterns it happens to trace out. Looking ahead, the economy is fine, earnings are good and the midterms yielded more gridlock, making radical legislation that negatively impacts businesses unlikely. Yet sentiment underrates this bullish reality—a recipe for upside surprise driving markets higher, in our view.
Volatility is painful. But a death cross doesn’t help you navigate it. It says nothing about where stocks are headed.
If you would like to contact the editors responsible for this article, please message MarketMinder directly.
*The content contained in this article represents only the opinions and viewpoints of the Fisher Investments editorial staff.
Get a weekly roundup of our market insights
Sign up for our weekly e-mail newsletter.

You Imagine Your Future. We Help You Get There.
Are you ready to start your journey to a better financial future?

Where Might the Market Go Next?
Confidently tackle the market’s ups and downs with independent research and analysis that tells you where we think stocks are headed—and why.
Related Resources
-
Economics A May Global Economic Check-In2026-05-26
-
Weekly Wrap-Up Fisher Investments Reviews: Last Week in Markets—May 18 - May 222026-05-26
-
In The News How to think about the Iran war — and what it means for oil and stocks2026-05-25
-
Expert Commentary 3 Things You Need to Know This Week | US Inflation, US Q1 GDP, Graduation Season
 2026-05-25


Learn More
Learn why 200,000 clients trust us to manage their money and how Fisher Investments and its affiliates may be able to help you achieve your financial goals.
As of 3/31/2026
New to Fisher? Call Us.
Contact Us Today