Personal Wealth Management / Market Analysis
Hey La, Hey La, Volatility Is Back?
Volatility can be pretty volatile sometimes, but at the moment, this is not one of those times.

Is this bull market taking a break to ride the Cyclone at Coney Island? Photo by Getty Images/Stringer.

Here is some fun with headlines: "Wall Street Gets a Case of the Jitters" and there is "No Rest for the Volatility-Weary on Wall Street" because this "Wild Stock Market Ride Is Just Beginning," and we all better "Expect More Volatility With Stocks Priced Near Perfection." From the general tone and word choice of these blurbs, you might infer stocks are roller-coastering their way through a correction-or at least significantly more herky-jerky than normal. In reality, however, this "volatility" is quite tame. Not that this means anything, of course. This non-volatile volatility is no more predictive of future volatility, corrections or overall market movement than normal volatility is.
We are told stocks are "volatile" right now because:
1) The S&P 500 fell -1.6% last Thursday
2) The Dow took "a knuckle-whitening 264-point plunge on Thursday"[i]
3) The Dow moved triple digits every day last week[ii]
4) Most broad indexes were in the red last week
5) Hong Kong's Hang Seng Index fell -1.9% Monday, as pro-democracy demonstrations continued
6) Other broad indexes fell a bit on Monday, too
All of those factoids are true! But the implication that this all amounts to wild price movement is a tad wide of reality. Thursday's S&P 500 drop might be the biggest since July 31's -1.99964% doozy,[iii] but it is also quite small compared to the rest of this bull market. Ditto for the last several days overall. And for the last year. Exhibits 1-6 show the S&P 500's daily percentage moves in each year of this bull market. As you will see, stocks aren't doing anything wacky these days. They are just being stocks, doing their normal bouncy stocky thing.
Exhibit 1: S&P 500 Price Index Daily Percentage Change, 03/09/2009-12/31/2009
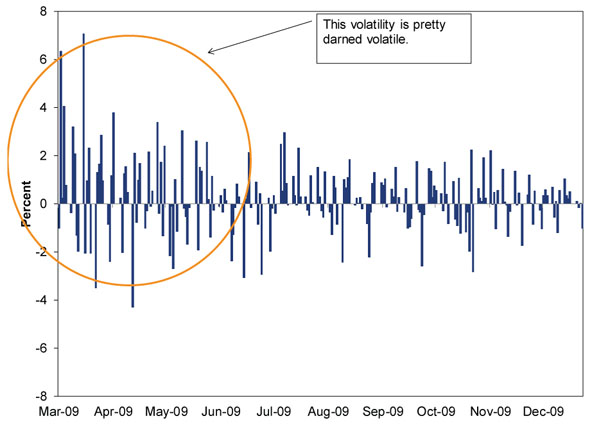
Source: FactSet, as of 9/29/2014. S&P 500 Price Index daily returns, 3/9/2009-12/31/2009.
Exhibit 2: S&P 500 Price Index Daily Percentage Change, 12/31/2009-12/31/2010
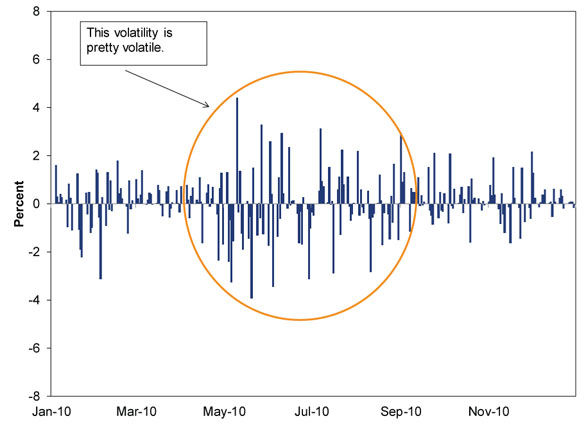
Source: FactSet, as of 9/29/2014. S&P 500 Price Index daily returns, 12/31/2009-12/31/2010.
Exhibit 3: S&P 500 Price Index Daily Percentage Change, 12/31/2010-12/31/2011
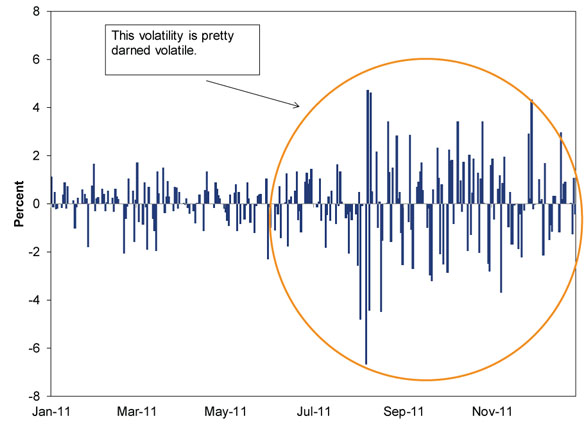
Source: FactSet, as of 9/29/2014. S&P 500 Price Index daily returns, 12/31/2010-12/31/2011.
Exhibit 4: S&P 500 Price Index Daily Percentage Change, 12/31/2011-12/31/2012
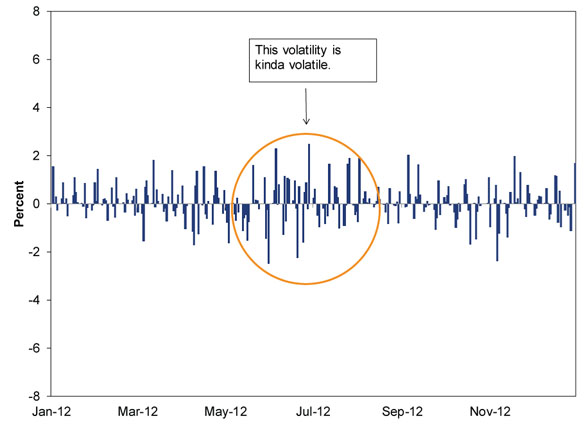
Source: FactSet, as of 9/29/2014. S&P 500 Price Index daily returns, 12/31/2011-12/31/2012.
Exhibit 5: S&P 500 Price Index Daily Percentage Change, 12/31/2012-12/31/2013
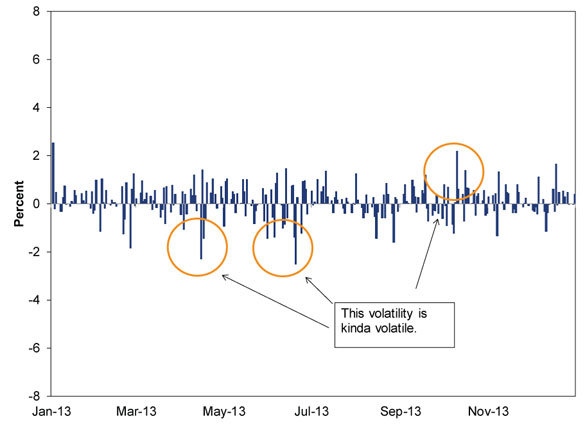
Source: FactSet, as of 9/29/2014. S&P 500 Price Index daily returns, 12/31/2012-12/31/2013.
Exhibit 6: S&P 500 Price Index Daily Percentage Change, 12/31/2013-09/26/2014
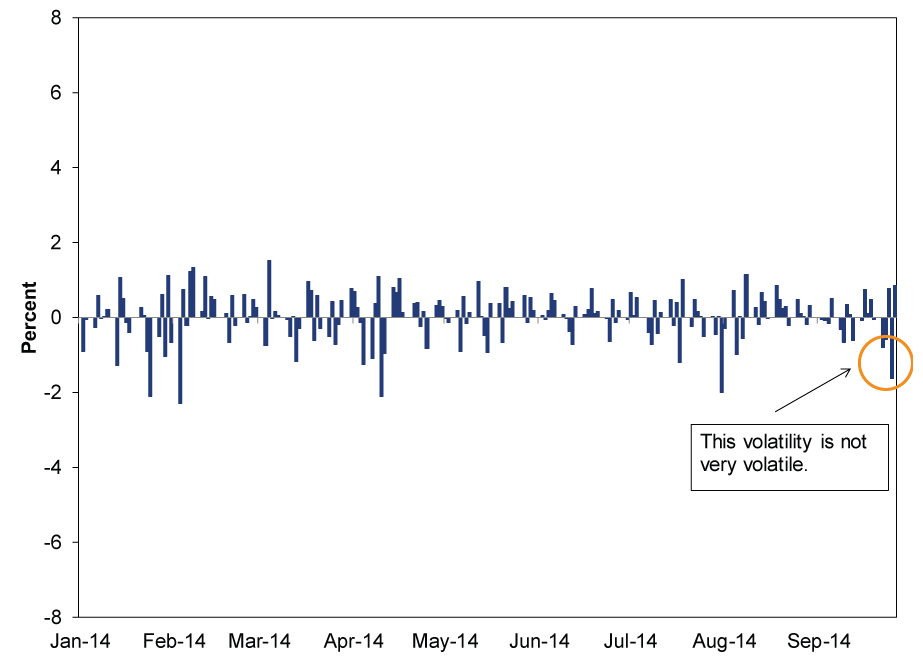
Source: FactSet, as of 9/29/2014. S&P 500 Price Index daily returns, 12/31/2013-12/31/2014.
The takeaway of this supposed volatility, according to the headlines, is that we should brace for a correction-a quick, sharp sentiment-driven drop of -10% to -20% over a few weeks or months-because markets are clearly warming up for something major. The secondary reasons run the gamut (and we're paraphrasing here) from "because we're due" to "it's almost October," "the unemployment report is coming out" and "P/Es are high." The implications being that markets must revert to the mean (in this case, the average length of time between corrections), October is the second half of financial hurricane season, good unemployment numbers will make markets freak over potential rate hikes, and high P/Es are bad.
There is no evidence, as far as we can tell, that any of these assertions are correct. Let's start with the whole "we're due" thing. "Due" implies schedule, but sentiment-driven market moves don't operate this way. There is no schedule. No syllabus. No expected arrival. No due. Global stocks have corrected five times during this bull market-twice in 2010, twice in 2011 and once in 2012. (Maybe number six started last week, but only time will tell.) As Exhibits 7 and 8 show, corrections were a much rarer breed during the prior two bull markets. It means nothing that the 27 months elapsed since the MSCI World's last correction exceed the average of 18 months between corrections during bull markets since 1974.[iv]
Exhibit 7: MSCI World Index During the 1990s Bull
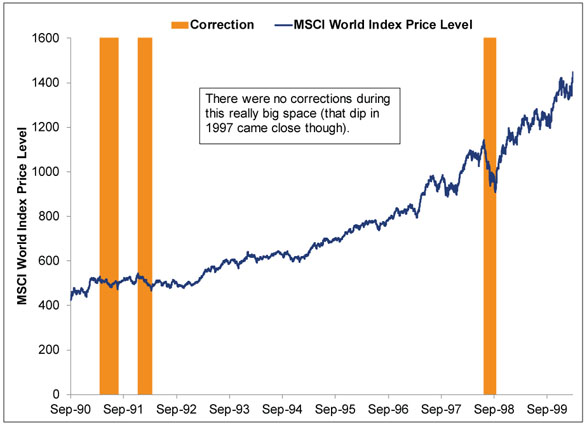
Source: FactSet, as of 9/29/2014. MSCI World Index, 9/28/1990-3/24/2000.
Exhibit 8: MSCI World Index During the 2002-2007 Bull
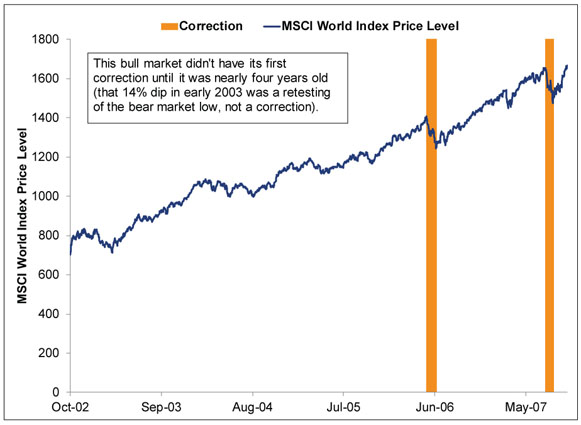
Source: FactSet, as of 9/29/2014. MSCI World Index, 10/9/2002-10/9/2007. Even if you want to call January to March 2003 a correction, it doesn't change matters because it ended in March 2003.
As for the rest. Claims October is inherently volatile are based on things like the VIX-not predictive, as we discuss here. October also isn't historically bad, with S&P 500 and MSCI World Index Octobers averaging positive returns over time.[v] And anyway, the past doesn't predict the future, so it's all a bit pointless to think about. As for unemployment and rate hike fears, as we show here, returns aren't inherently negative before or after the first rate hike of a tightening cycle, so the notion that good unemployment numbers means quicker rate hike means stocks go down is false. And as we've written here, here and here, neither normal P/Es or a certain Nobel Prizewinning Yale professor's overly smoothed P/E predict stock returns-not bear markets, corrections, bull markets or anything else. P/Es on the start dates of this bull market's five corrections were all over the map. Here is a chart.
Exhibit 9: MSCI World Index Corrections and P/Es
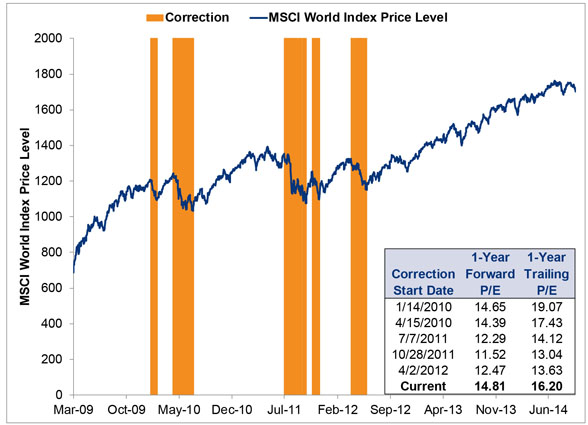
Source: FactSet and Multpl.com, as of 9/29/2014. MSCI World Index and P/E ratios, 3/9/2009-9/26/2014.
The simple truth about the way stocks have moved over the past week is really pretty boring, which is probably why you won't hear it from our hype-selling media. They want you to click, because that is how their business model works, and no one clicks on boring. But we have no problem writing boring truths,[vi] so here is the boring truth: There is nothing wild or abnormal about what stocks are doing right now. Recent wiggles are overall quite tame compared to recent and longer-term history, and they don't tell us anything about what happens next, because past performance never does. Could this turn into a correction? If it doesn't, could we get one soon? Yes and yes! But also maybe not and maybe not. These things are impossible to predict-you can't repeatedly, precisely forecast something that can start any time, for any reason (or even no reason!). You can only grit your teeth, hang on, and remember corrections are normal during bull markets, and riding them out is the uncomfortable price we all pay for stocks' superior long-term returns.
Stock Market Outlook
Like what you read? Interested in market analysis for your portfolio? Why not download our in-depth analysis of current investing conditions and our forecast for the period ahead. Our latest report looks at key stock market drivers including market, political, and economic factors. Click Here for More!
[i] This is less knuckle-whitening when you convert it to a percentage move. -264 just feels bigger than -1.5%, we guess?
[ii] Can we just stop with the whole quoting the Dow in points thing? Please? Because when you have an index at 17,000-plus, triple-digit moves don't mean much. Quoting it in points anyway, rather than scaling, seems like an attempt to whip up a frenzy where one really shouldn't exist.
[iii] We could have rounded this to -2.0%, but there was just something about all those nines. We didn't want to gloss over them.
[iv] Global Financial Data, Inc., as of 07/15/2014. MSCI World Index Price Returns, 12/31/1969-07/14/2017. Average includes any -10% peak-to-trough down move or greater down move during an official bull market.
[v] FactSet, as of 9/29/2014. S&P 500 Price Index monthly returns from 12/31/1928-12/31/2013 and MSCI World Index monthly price returns from 12/31/1969-12/31/2013.
[vi] But you can pretty much always rely on us to add a joke.
If you would like to contact the editors responsible for this article, please message MarketMinder directly.
*The content contained in this article represents only the opinions and viewpoints of the Fisher Investments editorial staff.
Get a weekly roundup of our market insights
Sign up for our weekly e-mail newsletter.

You Imagine Your Future. We Help You Get There.
Are you ready to start your journey to a better financial future?

Where Might the Market Go Next?
Confidently tackle the market’s ups and downs with independent research and analysis that tells you where we think stocks are headed—and why.
Related Resources
-
Market Analysis Why “War Winner” Trades Are Off Base2026-03-20
-
Expert Commentary This Week in Review | Energy Markets, Fed Meeting, Earnings Reporting
 2026-03-20
 -
Market Analysis Around the World in Central Banking, Iran War Edition2026-03-19
-
Politics Beyond the War: A Political Roundup Covering America, Canada and Denmark2026-03-17


Learn More
Learn why 195,000 clients trust us to manage their money and how Fisher Investments and its affiliates may be able to help you achieve your financial goals.
As of 12/31/2025
New to Fisher? Call Us.
Contact Us Today