Personal Wealth Management / Economics
Your Handy Late-May Data Roundup
In our view, a mixed bag of data isn’t out of the ordinary—or bearish.

Some seemingly weak economic data released last week grabbed headlines in America and abroad, causing many to fret global growth is waning—a risk for markets. However, an overall mixed bag of data is right in line with the recent trend—which has still resulted in broad growth.
Monthly US Data Can Be Volatile
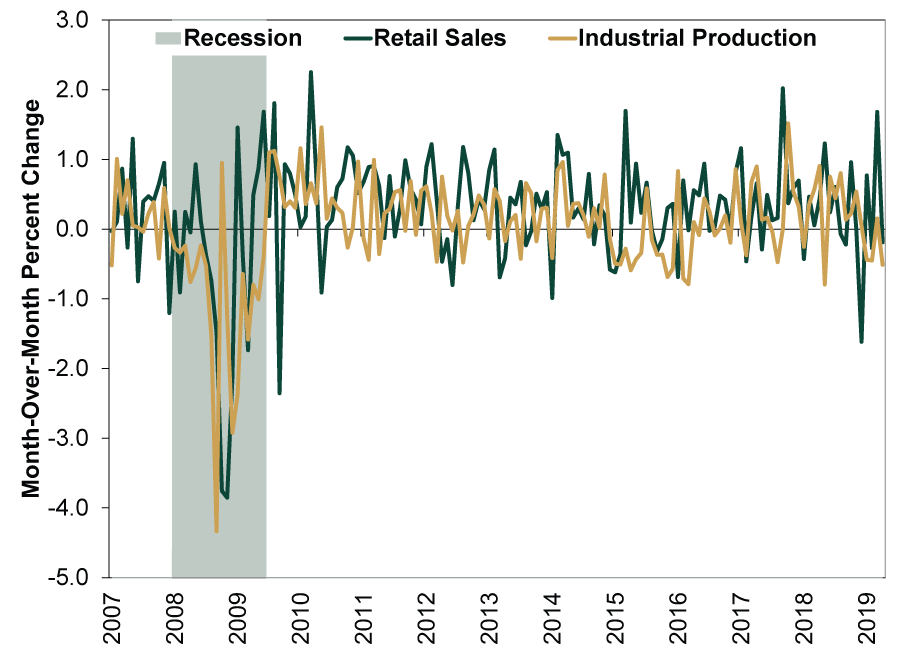
US industrial production (IP) and retail sales both fell in April, but under the hood, things don’t look uniformly weak. IP fell -0.5% m/m,[i] led lower by machinery, electrical equipment, motor vehicles and aircraft. The latter probably stemmed from one prominent aerospace manufacturer’s production cuts due to the grounding of its newest single-aisle, twin-engine jet after two recent fatal crashes. Utility weakness from warmer-than-normal weather also contributed to the decline, according to the Fed. This was IP’s third decline in four months, leading some to suggest trade woes are biting. But considering IP had a longer, weaker stretch in 2015 and early 2016, long before tariffs entered the conversation, this seems more like normal monthly data variability. That longer stretch also didn’t forestall broad economic growth.
As for retail sales, which dipped -0.2% m/m in April, it isn’t a shock to see a small pullback following a gangbusters March, when sales jumped 1.7%.[ii] Driving the dip: building materials, electronics and often-volatile motor vehicles. Excluding motor vehicles and parts, “core” retail sales rose 0.05%.[iii] Infinitesimal growth, but not negative. But as Exhibit 1 shows, one month’s headline decline—or several—aren’t unusual for these series. They are volatile. Monthly growth dips frequently into negative territory, which doesn’t automatically foretell greater weakness.
Exhibit 1: Monthly Wiggles Are Normal
Source: Federal Reserve Bank of St. Louis, as of 5/16/2019. Retail sales and industrial production, January 2007 – April 2019.
German GDP Accelerated in Q1
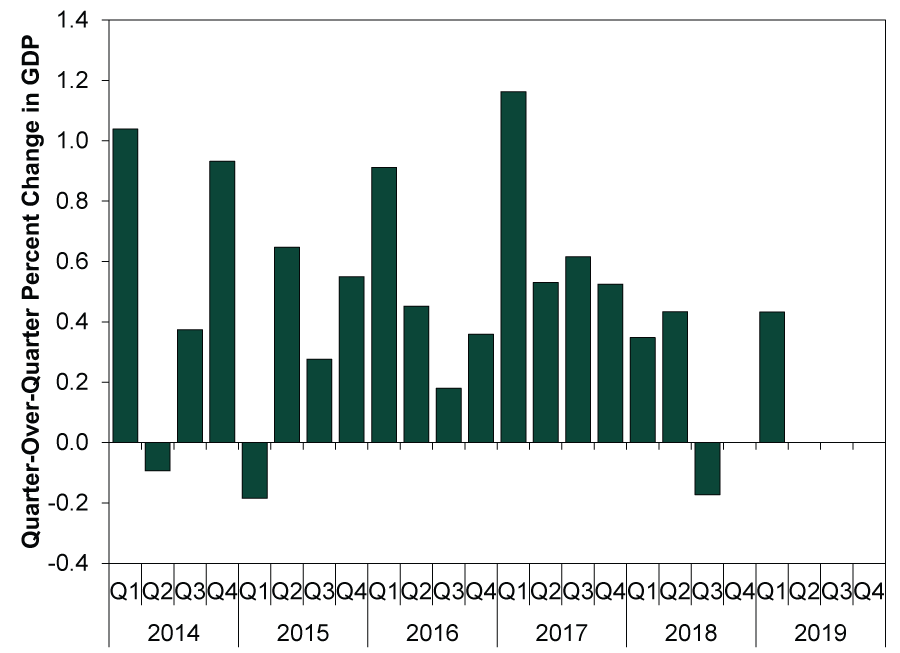
German GDP grew for the first time since Q2 2018, rising 0.4% q/q in Q1. (Exhibit 2) Private consumption, construction and investments in machinery and equipment drove the bounce from Q3’s contraction and Q4’s goose egg. Yet rather than cheering the rebound, some pundits warned it came from temporary factors, with more tough times looming. Sure, an auto industry rebound helped a lot, and that was tied mostly to last year’s production hiccups as the EU’s new emission standards took effect. Some leveling off there won’t surprise. But Germany has more than a one-time auto boost going for it. Ongoing export weakness was due primarily to China’s shadow banking crackdown restricting credit and denting demand, which is now easing (more below). As Chinese private sector demand recovers, so should European trade and industrial output.
Moreover, a dour outlook masks an improving reality—bullish. As IHS Markit reported recently for April, Germany’s dominant services sector “made a strong start to the second quarter of the year, according to the latest PMI [purchasing managers’ index] survey, recording the fastest growth in both business activity and new work since September last year.”[iv] PMIs measure only growth’s breadth, not its magnitude, but they imply broad increases in business activity. As more realize Germany’s true “growth engine” is far from sputtering, the wide gap between sentiment and reality should close, buoying German and eurozone stocks.
Exhibit 2: German Growth Resumes After a Soft Patch
Source: Eurostat, as of 5/16/2019. Germany real GDP, Q1 2014 – Q1 2019.
Still No Chinese Hard Landing
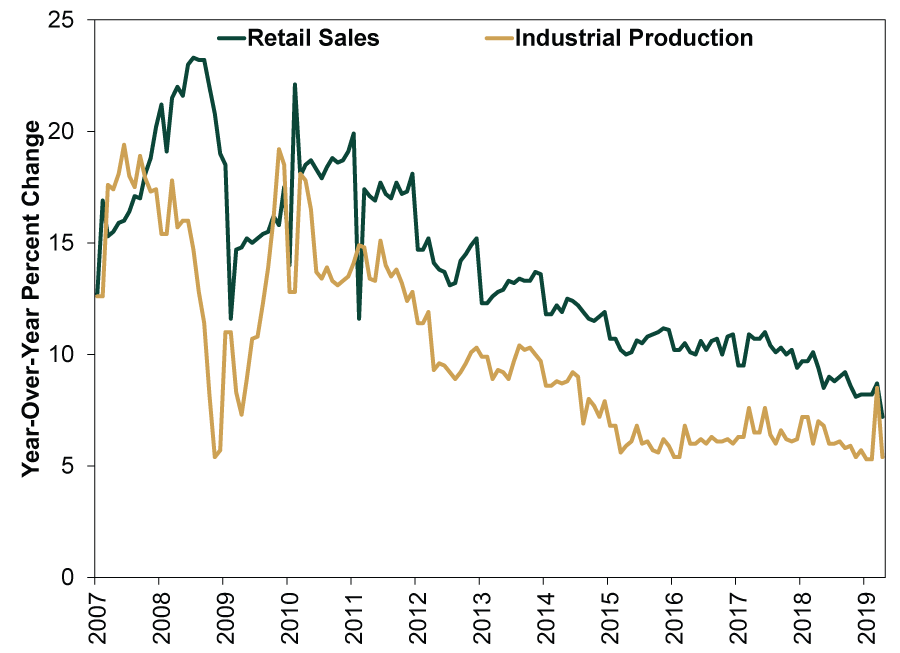
In China, April industrial production and retail sales rose 5.4% y/y and 7.2%, respectively. (Exhibit 3) Both growth rates were among their slowest in years, rekindling “hard landing” fears. But we see a few reasons to doubt this narrative. Credit stimulus is just starting to kick in. Monetary policy—like easing small business lending restrictions—typically affects output at a lag. Increased private sector loan growth suggests it is only beginning to hit the economy. Funds still need to be deployed—spent and invested—to register as economic activity in official statistics.
April PMI new orders suggest the wait shouldn’t be much longer. The government’s official manufacturing PMI new orders have grown since February.[v] Official non-manufacturing PMI new orders—mostly services, which cover over 57% of Chinese GDP[vi]—have expanded since September 2016, implying steady growth.[vii] The Caixin PMIs, which include smaller private businesses, also show manufacturing new orders expanding for the second straight month in April and ongoing services new orders growth.[viii] It is likely only a matter of time before today’s orders become tomorrow’s production.
Exhibit 3: China’s Slowdown Is Nothing New
Source: FactSet, as of 5/16/2019. China retail sales and industrial production, January 2007 – April 2019. January and February figures combined due to the shifting timing of the Lunar New Year holiday.
Corporate America’s Underlying Earnings Strength
With 92% of S&P 500 companies reporting through May 17,[ix] Q1 earnings are on track to decline -0.5% y/y. In the end, that is better than expectations for a -4.2% y/y drop and only a small pullback from Q1 2018, the first of four quarters where earnings benefited from tax cuts’ temporary boost. Looking at sales growth strips out the impact of that one-off cost-cut. As it happens, Q1 revenues grew 5.3% y/y—also beating expectations for 3.7%.
Q2 earnings may also be negative—current predictions are for a -1.9% y/y decline—and many pundits warn an “earnings recession” bodes poorly for stocks.[x] But that implies negative earnings are always and everywhere bad for stocks—a point actual market returns have often disagreed with. Plus, we think stocks are already looking ahead. Stocks tend to focus on the 3 – 30 month outlook, particularly the next 12 – 18 months. How the earnings outlook evolves moving forward likely matters more than Q2 results at this point. For now, analysts pencil in second-half acceleration with full-year earnings up 3.5% y/y—on top of 2018’s tax-boosted 20% growth—driven by 4.7% revenue growth.
[i] Source: Federal Reserve, as of 5/15/2019. Industrial production, April 2019. https://www.federalreserve.gov/releases/g17/current/default.htm
[ii] Source: US Census Bureau, as of 5/15/2019. Retail sales, April 2019. https://www.census.gov/retail/marts/www/marts_current.pdf
[iii] Ibid.
[iv] Source: IHS Markit, as of 5/6/2019. German Services PMI, April 2019. https://www.markiteconomics.com/Public/Home/PressRelease/9717bb460a184bcbb2d4ac5442c2efc2
[v] Source: National Bureau of Statistics of China, as of 5/5/2019. Manufacturing purchasing managers index, April 2019. https://www.stats.gov.cn/english/PressRelease/201905/t20190505_1662899.html
[vi] Ibid., as of 4/18/2019. Value-added of the Tertiary Industry divided by GDP, Q1 2019. https://www.stats.gov.cn/english/PressRelease/201904/t20190418_1660345.html
[vii] Ibid., as of 5/5/2019. Non-manufacturing purchasing managers index, April 2019. https://www.stats.gov.cn/english/PressRelease/201905/t20190505_1662899.html
[viii] Source: IHS Markit, as of 5/6/2019. Caixin China General Manufacturing and Services PMIs, April 2019. https://www.markiteconomics.com/Public/Home/PressRelease/26c51700cb5f4224bda8595676615fdb https://www.markiteconomics.com/Public/Home/PressRelease/f999d78bf06c4d6c9ed4ff342b9068fe
[ix] Source: FactSet Earnings Insight, as of 5/17/2019. https://www.factset.com/hubfs/Resources Section/Research Desk/Earnings Insight/EarningsInsight_051719.pdf
[x] Ibid.
If you would like to contact the editors responsible for this article, please message MarketMinder directly.
*The content contained in this article represents only the opinions and viewpoints of the Fisher Investments editorial staff.
Get a weekly roundup of our market insights
Sign up for our weekly e-mail newsletter.

You Imagine Your Future. We Help You Get There.
Are you ready to start your journey to a better financial future?

Where Might the Market Go Next?
Confidently tackle the market’s ups and downs with independent research and analysis that tells you where we think stocks are headed—and why.
Related Resources
-
Expert Commentary This Week in Review | Q2 Market Recap, June US Jobs, Trade Deal Update
 2026-07-03
 -
Market Analysis Why El Niño Doesn’t Necessitate Portfolio Shifts2026-07-01
-
Market Analysis Declaring Fed Independence Fears False2026-07-01
-
Market Analysis Reader Mailbag: June 20262026-06-30


Learn More
Learn why 200,000 clients trust us to manage their money and how Fisher Investments and its affiliates may be able to help you achieve your financial goals.
As of 3/31/2026
New to Fisher? Call Us.
Contact Us Today