Personal Wealth Management / Market Analysis
A Snapshot of the Global Economy in 10 Charts
With more than a third of 2019 over, the global economy seemingly remains on solid footing.

At last year’s close, negative market volatility knocked sentiment and drove recession forecasts. Since then, global economic recession worries have given way to others, including eurozone country recessions, an industrial recession and even a US earnings recession. Couple those with concerns of slowing global economic growth, a Chinese “hard landing” and a US yield curve inversion, and fears have abounded. Yet with more than a third of 2019 in the books and Q1 GDP reports hitting the wire, data suggest early-year worries about the global economy have likely been misplaced. In our view, sentiment hasn’t caught up to this reality yet—with many continuing to fret growth and, this week, tariffs. To us, the positive surprise of persistent expansion is a reason stocks should continue rising this year.
One of the early contenders for 2019’s Fear of the Year™ has been the global industrial slowdown—reflected most notably in eurozone manufacturing purchasing managers’ indexes (PMIs, monthly surveys indicating the percentage of firms expanding or contracting). While we expect this to prove fleeting, it is more noteworthy that less-heralded services PMIs have held up fine. Considering services comprise the majority of eurozone GDP, its steady growth suggests the expansion is faring better than many appreciate.
Exhibit 1: Eurozone PMIs, Services vs. Manufacturing
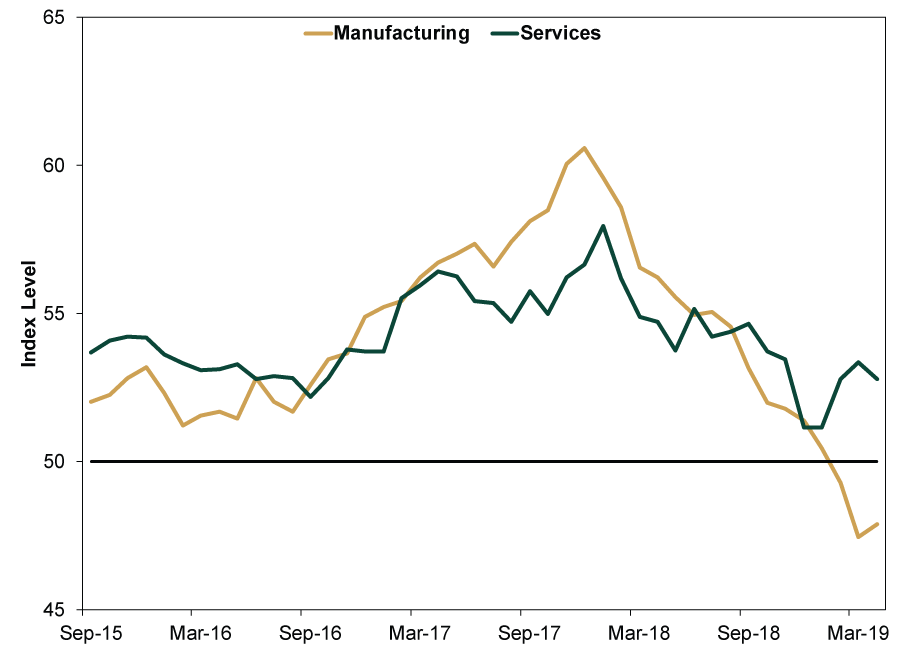
Source: FactSet, as of 5/7/2019. IHS Markit eurozone services and manufacturing PMIs, September 2015 – April 2019.
Beyond the eurozone, global manufacturing and services PMIs both remain above 50—another sign the expansion remains intact.
Exhibit 2: Global PMIs, Services vs. Manufacturing
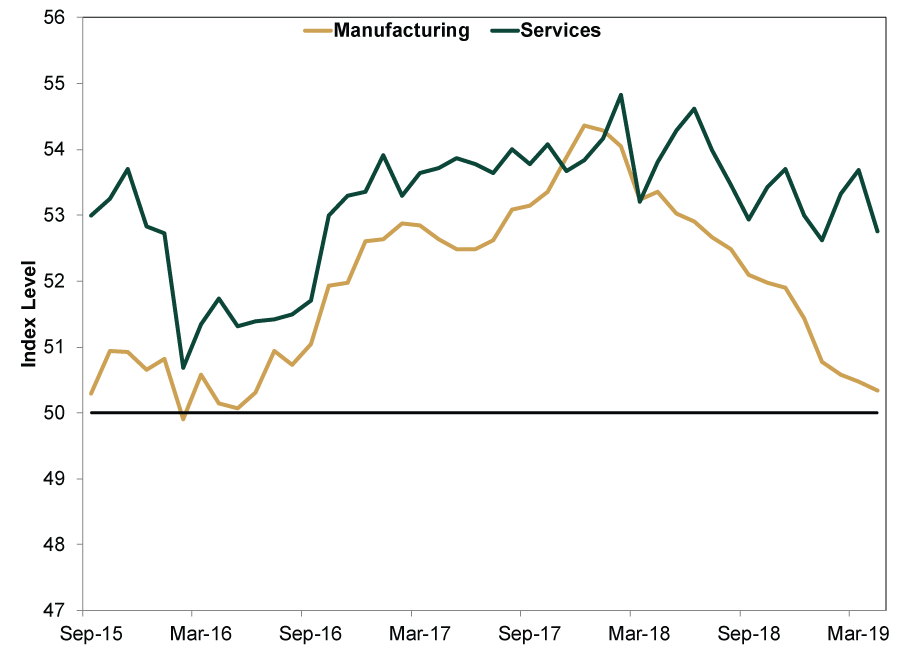
Source: FactSet, as of 5/8/2019. JP Morgan PMI Global, services and manufacturing, September 2015 – April 2019.
More broadly, Q1 GDP reports confirm growth in both the US and eurozone. Notably, much-maligned Italy emerged from its “technical recession”—defined as two or more contractionary quarters.
Exhibit 3: US and Eurozone GDPs Growing to Start 2019
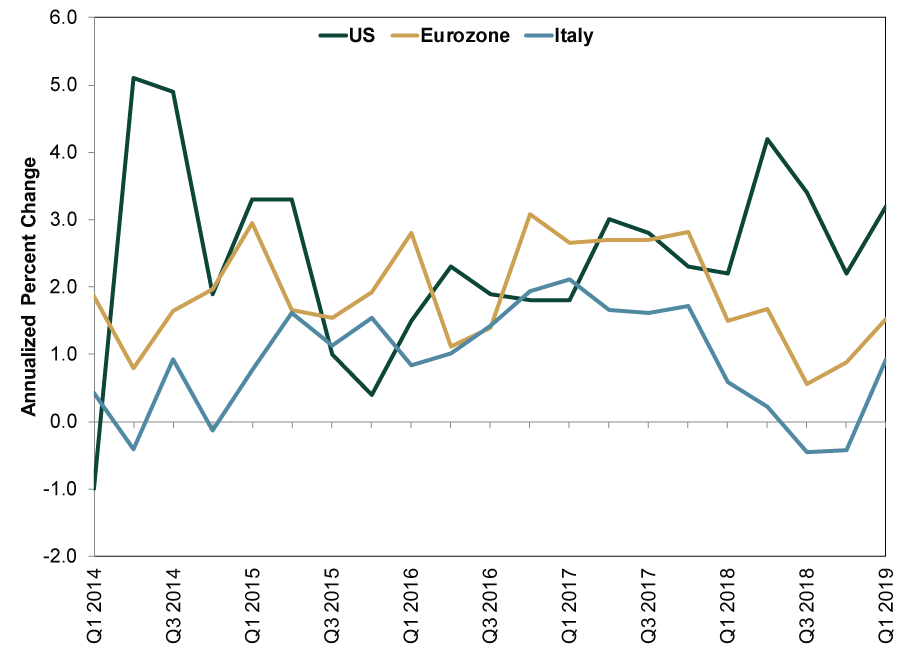
Source: FactSet, as of 5/8/2019. US, eurozone and Italy real GDP, Q1 2014 – Q1 2019.
Pundits warned US corporate earnings would weaken this year, perhaps leading to an “earnings recession” (i.e., two or more consecutive quarters of negative earnings growth)—an overwrought fear, in our view. Q1 earnings season isn’t over yet, but with 391 S&P 500 firms reporting, earnings estimates have improved from -3.9% y/y to almost flat, while sales estimates have grown steadily.
Exhibit 4: S&P 500 Earnings Are Faring Better Than Thought
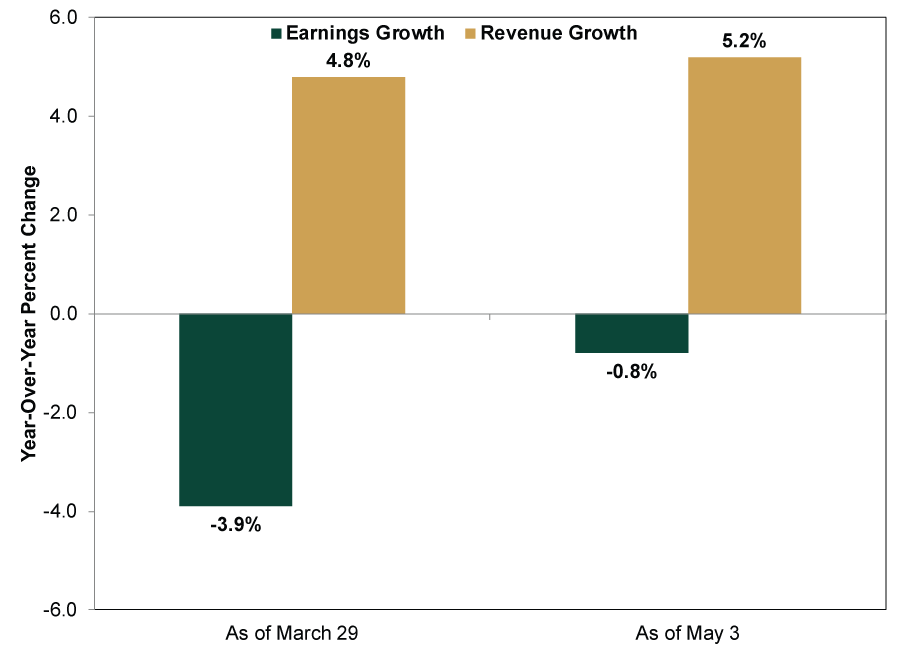
Source: FactSet Earnings Insight reports for weeks ending 3/29/2019 and 5/3/2019.
The US 10-year – 3-month yield curve’s inversion (short rates exceeding long)—a fairly reliable sign a future recession lurks—near the end of Q1 fueled further worries of looming economic trouble. But this shallow inversion lasted a mere four days before reversing—a lot of hype for a rather innocuous event and a reminder not to use the yield curve as a timing tool.
Exhibit 5: The Four-Day Inversion
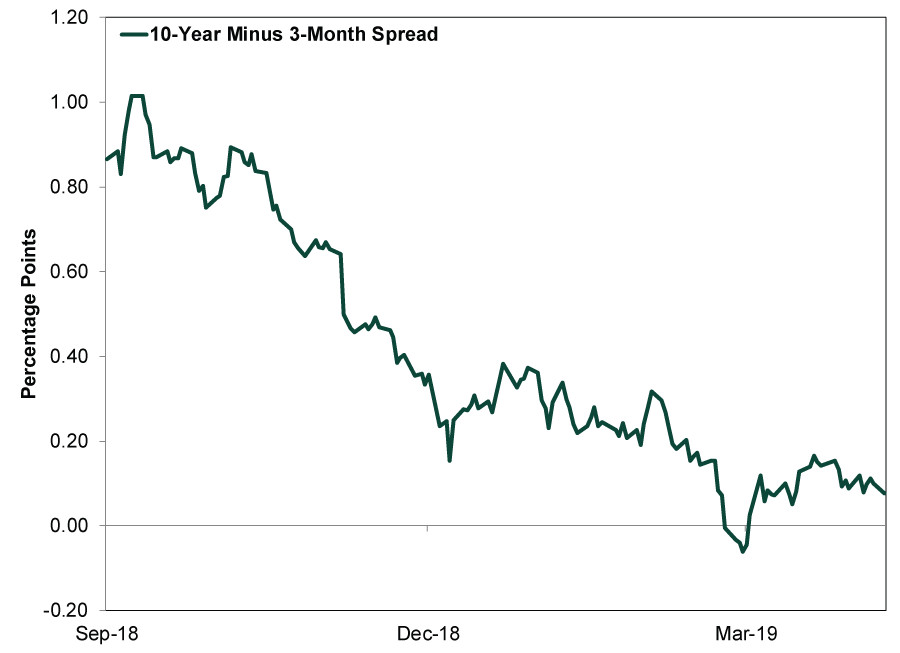
Source: FactSet, as of 5/7/2019. US 10-year Treasury yield minus 3-month Treasury yield, 9/28/2018 – 5/6/2019.
Looking ahead, we see many reasons for optimism. Chinese policymakers have launched a number of stimulus measures aimed at boosting smaller banks and businesses hurt by last year’s shadow banking crackdown. Green shoots have started to appear.
Exhibit 6: China’s Recent Stimulus in Perspective
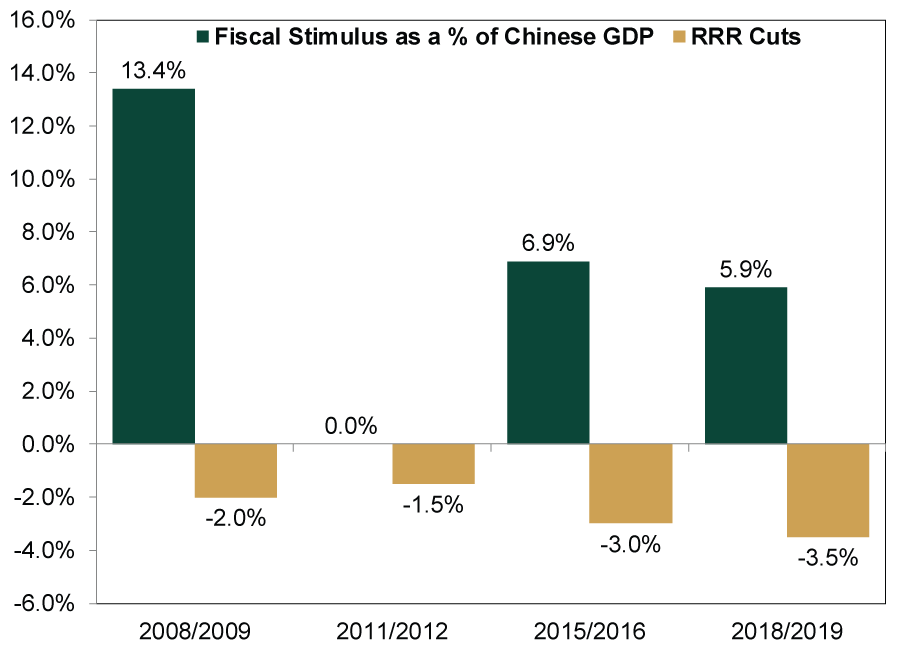
Source: FactSet, World Bank as of 5/3/2019. Chinese fiscal stimulus (defined as infrastructure spending and tax cuts) and reserve requirement ratio (the minimum amount of cash a bank holds in reserve as a percentage of liabilities), 2008 – 2019. H/T Scott Botterman.
Here in the US, both manufacturing and nonmanufacturing PMIs remain expansionary—as do their new orders subindexes, suggesting most firms see growth ahead.
Exhibit 7: US ISM’s Manufacturing PMI and New Orders
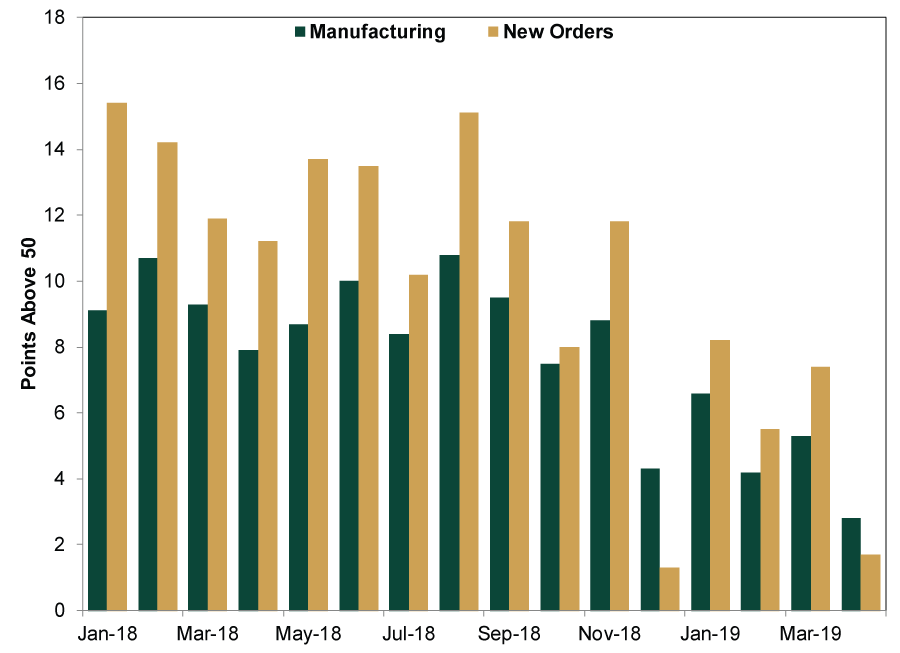
Source: FactSet, as of 5/8/2019. ISM’s manufacturing PMI, headline and New Orders subindex, January 2018 – April 2019.
Exhibit 8: US ISM’s Nonmanufacturing PMI and New Orders
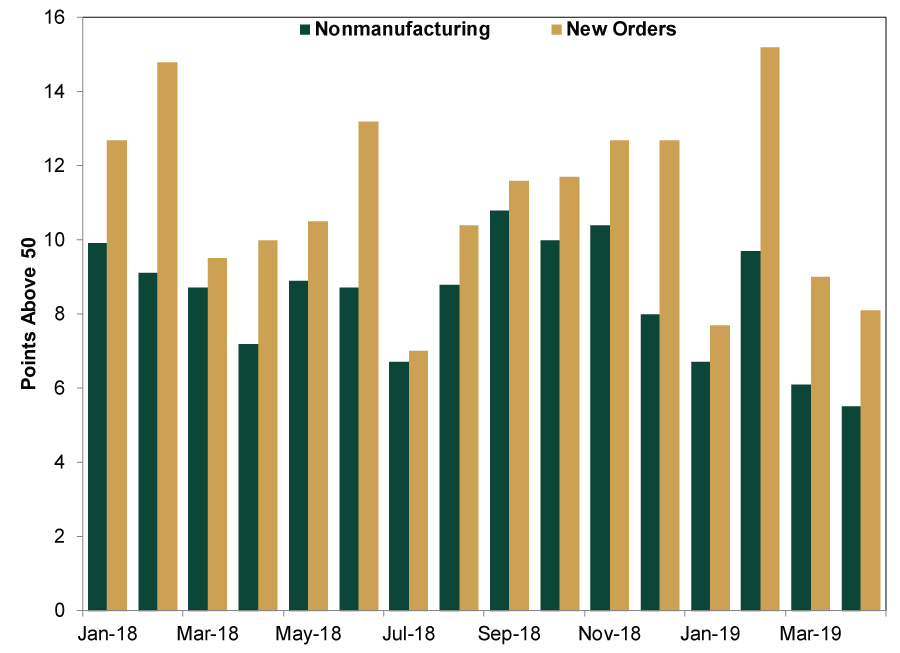
Source: FactSet, as of 5/8/2019. ISM’s nonmanufacturing PMI, headline and New Orders subindex, January 2018 – April 2019.
While the shallow US yield curve inversion grabbed eyeballs, the global yield curve still slopes upward—a positive sign for global lending. Banks borrow short term to fund long-term loans, and they can source funding from almost any developed nation. This should support lending in America.
Exhibit 9: The Global Yield Curve
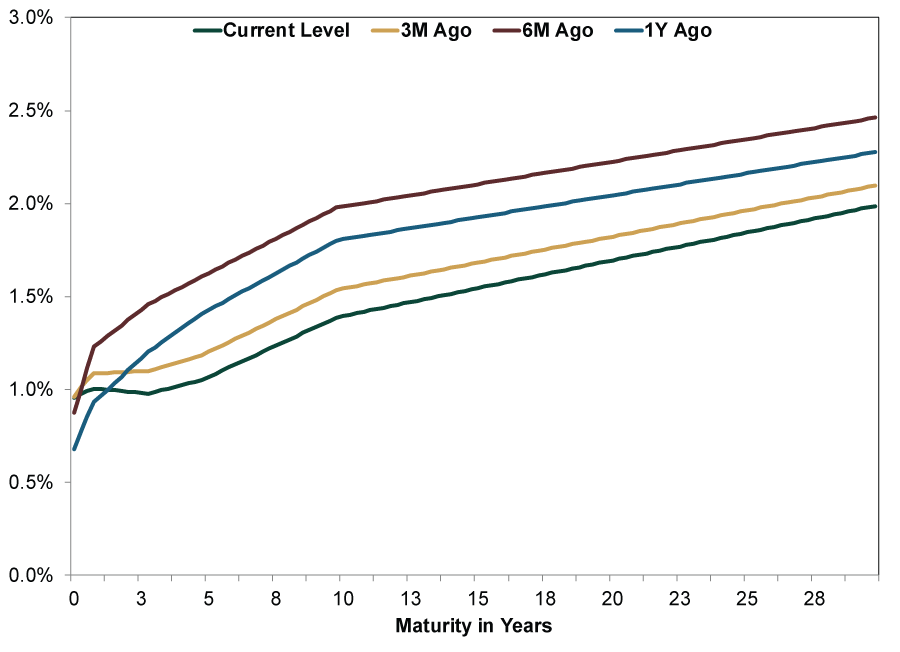
Source: FactSet, as of 5/9/2019. Global (excluding Emerging Markets) GDP-weighted yield curve on 5/9/2019.
Finally, The Conference Board’s Leading Economic Indexes (LEIs) for both the US and eurozone remain on an uptrend, pointing to more growth ahead.
Exhibit 10: US and Eurozone LEIs Trending Up
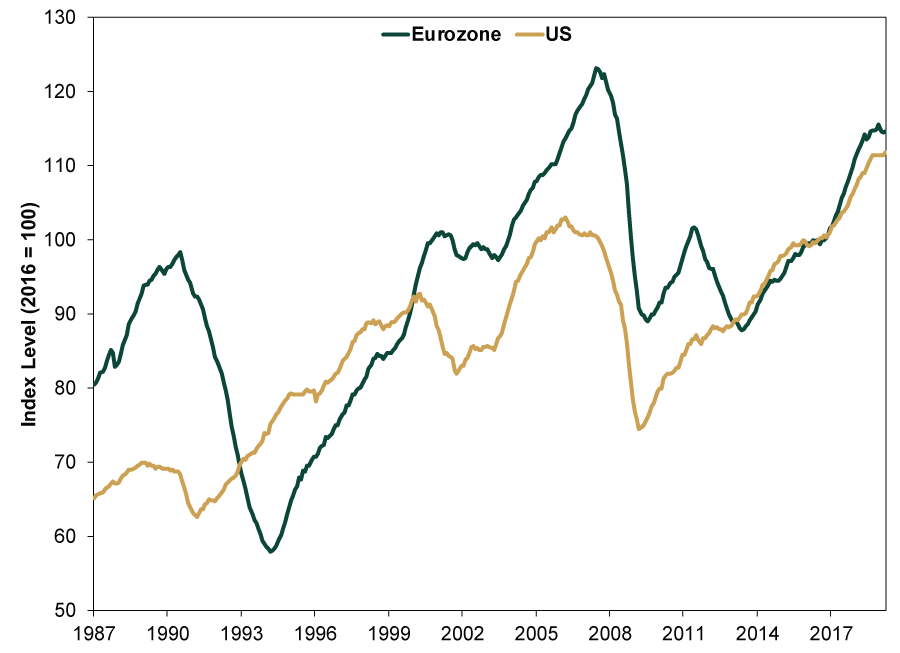
Source: The Conference Board, as of 5/8/2019. US and Euro Area Leading Economic Indexes, January 1987 – March 2019.
With dour sentiment still prevalent, we believe a still-expanding global economy will surprise folks to the upside—reason to be bullish about stocks this year, in our view.
If you would like to contact the editors responsible for this article, please message MarketMinder directly.
*The content contained in this article represents only the opinions and viewpoints of the Fisher Investments editorial staff.
Get a weekly roundup of our market insights
Sign up for our weekly e-mail newsletter.

You Imagine Your Future. We Help You Get There.
Are you ready to start your journey to a better financial future?

Where Might the Market Go Next?
Confidently tackle the market’s ups and downs with independent research and analysis that tells you where we think stocks are headed—and why.
Related Resources
-
Market Analysis What the Latest Global Flash PMIs Reveal2026-03-31
-
Market Analysis Beyond Iran: A Non-Conflict March Mailbag Q&A2026-03-30
-
Weekly Wrap-Up Fisher Investments Reviews: Last Week in Markets—March 23 - March 272026-03-30
-
Expert Commentary US Jobs, Eurozone Inflation, Private Credit | 3 Things You Need to Know This Week
 2026-03-30


Learn More
Learn why 195,000 clients trust us to manage their money and how Fisher Investments and its affiliates may be able to help you achieve your financial goals.
As of 12/31/2025
New to Fisher? Call Us.
Contact Us Today