Personal Wealth Management / Market Analysis
Don’t Let the Yield Curve Flatten Your Spirits
A flatter yield curve doesn't mean recession is around the corner.

In these allegedly very uncertain times, one constant remains: the perpetually dour media. Headlines fret the state of the global economy daily, cycling through a steady stream of worries. This week, a fear from the recent past-a Fed rate hike-resurfaced, as the April Fed meeting minutes drove speculation Janet Yellen and Co. will hike in June if economic data are strong enough.[i] Perhaps related to shifting expectations of a hike, short-term US Treasury yields have drifted higher lately, spurring jitters over the yield curve flattening. While we have pointed out why rate hikes aren't inherently bearish a handful of times (ok, many, many, many times), what are investors to make of the developments surrounding the yield curve, a forward-looking indicator we frequently refer to? Though the yield curve has indeed flattened a bit in 2016, that doesn't automatically set the US economy up for a tumble, either.
First, a refresher: The yield curve refers to the distribution of bond yields across all maturities from one borrower. The spread is the difference between long-term and short-term rates, which also serves as a proxy for loan profitability for banks. Banks' core business is to borrow short (e.g., deposit accounts) to fund longer-term loans (e.g., mortgages, car loans, etc.), so the more long-term rates exceed short, the more money the bank would make. Hence, a positive spread would likely encourage banks to lend to capture the profit, and more plentiful capital stimulates economic growth.
Typically speaking, yield curves are positively sloped because longer-maturity loans mean the lender is exposed to risks for longer and rationally demands higher rates to compensate. However, that isn't always true. An inverted yield curve-when it costs more to borrow short than long-indicates something isn't right in credit markets and that weak economic conditions may be forthcoming. A flat yield curve lies somewhere in between-banks may be a bit more hesitant to lend, given they are paid less for the risk they take, but it still wouldn't necessarily be unprofitable to do so. The importance of the yield curve to future growth is why The Conference Board's forward-looking Leading Economic Index (LEI) uses the interest rate spread of 10-year Treasurys less federal funds-it provides a telling sign about the upcoming economic environment. So what are folks fretting about today?
Well, some in the media have noticed the yield curve flattening, alleging this indicates trouble ahead. On the one hand, we give kudos to those noting the yield curve's importance, especially when so many folks wrongly cite backward-looking, limited gauges about the economy's direction. However, those worrying this flatter yield curve bodes poorly for the future miss some key points. For one, the arguments we have seen cite the 10-year Treasury relative to the 2-year note-essentially pointing out the 2-year's very recent rise outpaces the 10-year's.
Exhibit 1: Yields-10-Year Treasury, 2-Year Treasury and Effective Fed Funds
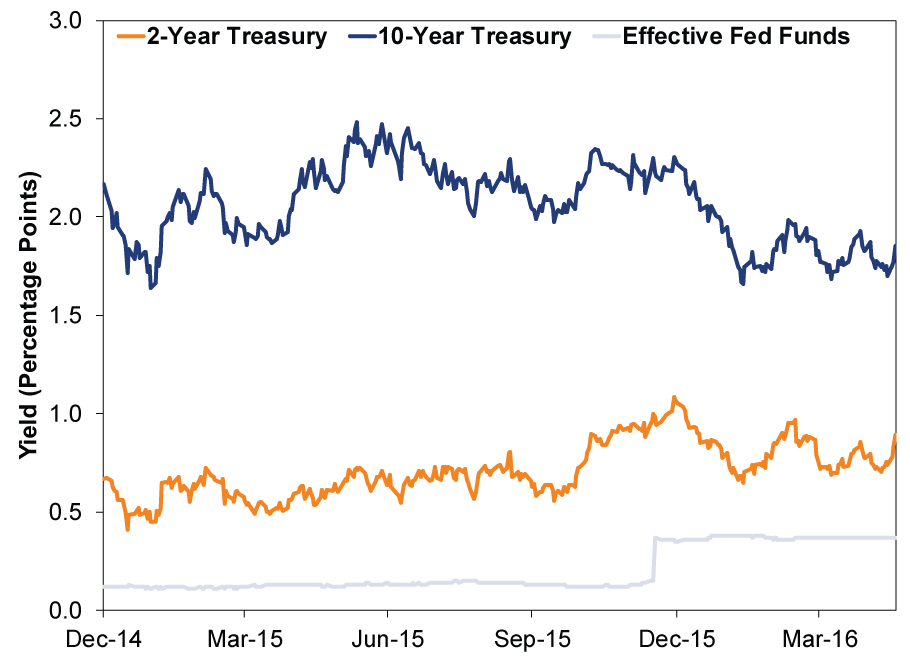
Source: FactSet, as of 5/19/2016. 12/31/2014 - 5/18/2016.
This is slightly off, because banks don't fund themselves at the 2-year rate. A more accurate comparison: 10-year relative to the fed funds, or overnight, rate. Since 10-year rates are up and fed funds are not, the yield curve that matters more has widened in recent weeks. Now admittedly, that is short term: The gap between 10-year and fed funds rates has narrowed a bit too, related to the Fed's December hike and a slight downtick in 10-year rates this year to date. It also could flatten more if the Fed hikes next month (which the two-year seems to be pricing in the possibility of now). Yet it is not assured of doing so, as the Fed may not hike, and long rates could easily rise enough to offset higher short rates. But whatever happens next month, the yield curve's 2016 flattening doesn't seem problematic-true whether you use the 10-year/fed funds spread or the 10-year/2-year. (Exhibits 2-3)
Exhibit 2: 10-Year Treasury Minus Federal Funds Rate
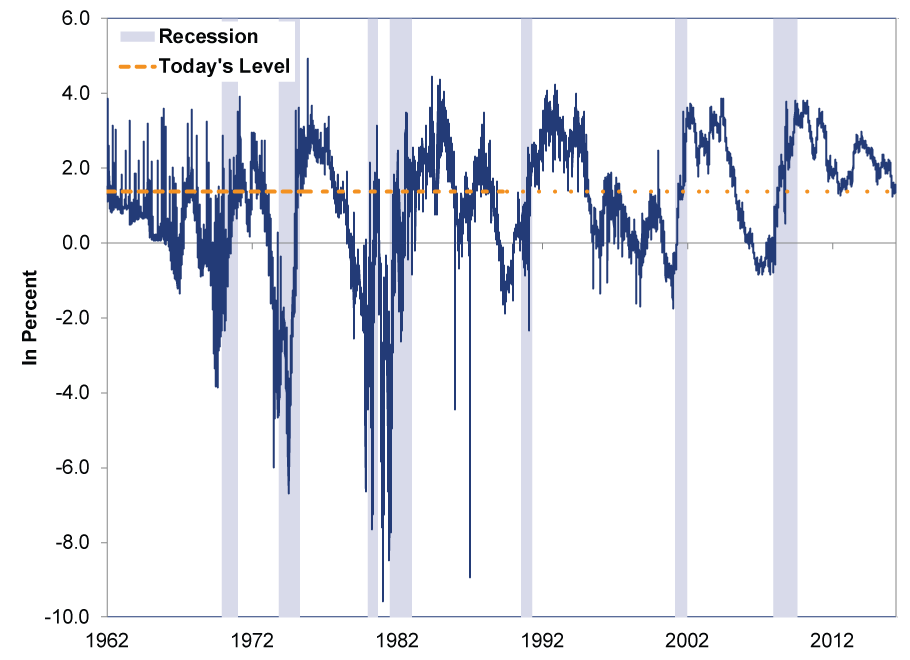
Source: St. Louis Federal Reserve, as of 5/17/2016. Spread between 10-year Treasury constant maturity and Effective Federal Funds Rate, from 1/2/1962 - 5/16/2016. The big, isolated down spikes (e.g., the two in the mid-1980s shows) were specific to funding over the New Year's holiday in each-technical issues that didn't last. See this for more.
Exhibit 3: 10-Year Treasury Minus 2-Year Treasury
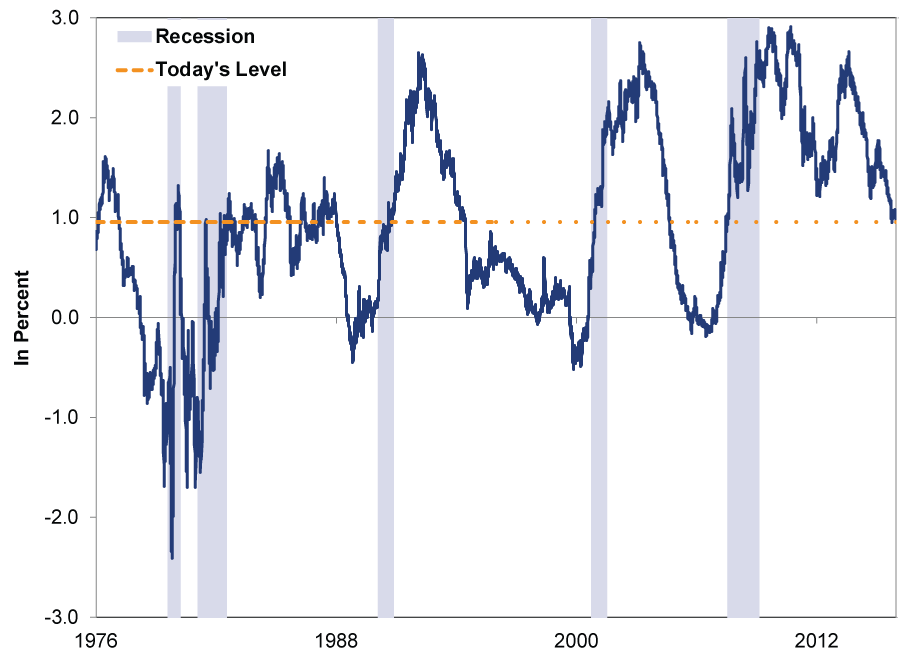
Source: St. Louis Federal Reserve, as of 5/17/2016. Spread between 10-year Treasury constant maturity and 2-year Treasury constant maturity, from 6/1/1976 - 5/16/2016.
If these charts seem pretty noisy, that's kind of our point-nothing about the current spread between the 10-year and either the fed funds rate or 2-year seems alarming from a historical perspective. There are a slew of times the yield spread was at today's level-or even lower-without presaging an imminent recession.
Moreover, while the yield curve is a useful tool to assess future economic growth, it isn't a perfect timing tool, either. Consider inverted yield curves. Though a moot point in the here-and-now because, as noted, the yield curve is positively sloped, their history is telling: An initial yield curve inversion is unlikely to flash an immediate sell signal marking the peak before a bear market. It isn't nearly that easy, as Exhibit 4 shows.
Exhibit 4: Inverted Yield Curves Don't Signal Imminent Trouble
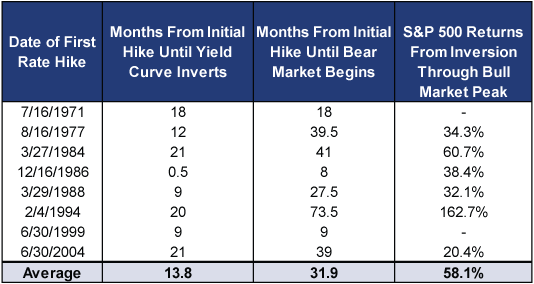
Source: FactSet and Global Financial Data, as of 5/18/2016. S&P 500 Price Return Index for following periods: 8/16/1978 - 11/28/1980; 12/27/1985 - 8/25/1987; 12/30/1986 - 8/25/1987; 12/29/1988 - 7/16/1990; 10/4/1995 - 3/24/2000; 3/30/2006 - 10/9/2007.
An inverted yield curve signals credit markets aren't all that healthy, but it could take a while before issues spring up. Initial yield curve inversion has only aligned with a bull market peak twice since 1971. Similarly, there are two times the yield curve inverted and then flipped back to positive without signaling a bear.
Now to be clear, we aren't dismissing those citing the flattening yield curve. The yield curve is a perfectly valid factor to monitor, and we do so constantly. However, as good an indicator as it is, we remind investors that no single metric will tell you everything about the economy, both the past and especially the future. Historical context is important too, as it shows that a slightly flatter-but still positively sloped-yield curve doesn't foretell trouble. Beyond the yield curve, we believe there is plenty of evidence suggesting the US economy is on firm footing and looks poised to chug along for the foreseeable future, continuing to foil fearful headlines.
[i] "Strong enough" a very subjective term, of course.
If you would like to contact the editors responsible for this article, please message MarketMinder directly.
*The content contained in this article represents only the opinions and viewpoints of the Fisher Investments editorial staff.
Get a weekly roundup of our market insights
Sign up for our weekly e-mail newsletter.

You Imagine Your Future. We Help You Get There.
Are you ready to start your journey to a better financial future?

Where Might the Market Go Next?
Confidently tackle the market’s ups and downs with independent research and analysis that tells you where we think stocks are headed—and why.
Related Resources
-
Market Analysis Quick Hit: What to Make of Jobs Data’s Persistent Swings2026-04-07
-
Weekly Wrap-Up Fisher Investments Reviews: Last Week in Markets—March 30 - April 32026-04-06
-
Expert Commentary US Inflation, Fed Minutes, Consumer Sentiment | 3 Things You Need to Know This Week
 2026-04-06
 -
Expert Commentary This Week in Review | Q1 Recap, Earnings Guidance, Elections
 2026-04-03


Learn More
Learn why 200,000 clients trust us to manage their money and how Fisher Investments and its affiliates may be able to help you achieve your financial goals.
As of 3/31/2026
New to Fisher? Call Us.
Contact Us Today