Personal Wealth Management / Market Analysis
Prophet Margins?
A projected downtick in S&P 500 profit margins is not a prophecy of doom.


US firms are still earning a lot of these. Photo by Sanjit Das, Bloomberg via Getty Images.
When you're stuck writing about the same thing a bazillion times, it gets hard to find a fresh angle that won't bore readers to tears. So we give the media a point for finding a new twist on weak earnings fears: profit margins. Yes, instead of spilling 500+ words over projected year-over-year declines in S&P 500 earnings and revenues, pundits are diving under the hood, doing a little math, and dissecting net profit margins. Something new! But the takeaway is the same old, same old: Margins have ticked down a wee bit, which many fear foretells trouble in the economy and stocks. It also makes the same error as most of the traditional earnings commentary in recent months: failing to account for the Energy sector's impact on the total.[i] If you combine a more granular look with some historical perspective, profit margins actually look quite good, not bad.
Profit margins-profits divided by revenues-are a handy way to estimate how big a buffer firms have. Gross profit margins are probably the purest measure, as they're free of accounting trickery-just revenues minus cost of goods sold, divided by revenues. Those can also be difficult to round up for the broader market, however, so most folks look at net profit margins, which divide reported earnings by reported revenues. When margins are big, it is a sign firms can stay plenty profitable even if revenues fall a bit. When margins are slim, firms have less wiggle room and might need to cut costs to stay in the black if they hit a speed bump.
Today's popular narrative goes like this: S&P 500 net profit margins are expected to decline in Q3, but firms have already cut costs as low as can be, so as the strong dollar and China's slowdown hit revenues, earnings will suffer. You can find our thoughts on the dollar and China here and here[ii]-these are overstated headwinds, in our view. It is also sheer myth that this expansion's earnings growth stems from cost-cutting alone. As we detailed here, here and here, revenues are up nicely. Plus, costs can still fall further, whether or not management whips out their scissors and starts snipping at projects and expenses. Energy, imported parts and overseas labor are major costs for most big firms. Prices of all are down, thanks to falling commodity prices and the stronger dollar. This is a big, freebie cost-cut and an underappreciated earnings booster.
Except, of course for Energy and Materials firms, whose revenues depend on high oil and commodity prices. Their revenues and earnings have suffered the last few years, with Energy bearing the brunt of it. In past quarters, we've stripped Energy from the S&P 500's earnings tally to show how one bad sector can obscure strength throughout the broader market, and here we do the same for net margins. Exhibit 1 shows the last few quarters for the S&P 500 with and without Energy, while Exhibit 2 shows Q2 and projected Q3 net margins for all 10 sectors.
Exhibit 1: S&P 500 Net Profit Margins
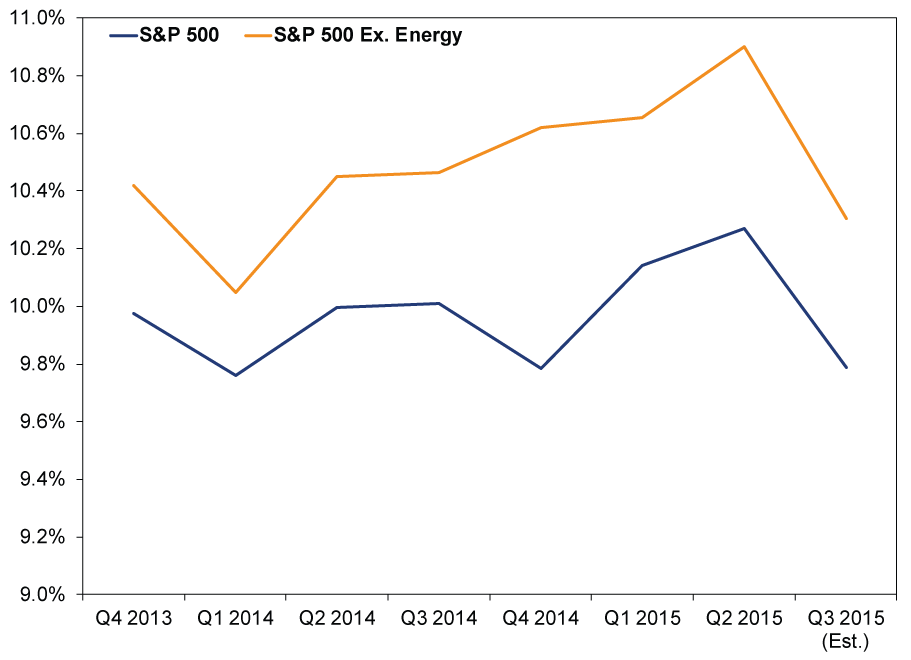
Source: FactSet, as of 10/13/2015. S&P 500 calendar quarter net income divided by S&P 500 calendar quarter sales, with and without Energy, Q3 2013 - Q3 2015. Q3 2015 uses consensus estimates; all others are actual results.
Exhibit 2: S&P 500 Net Profit Margins by Sector
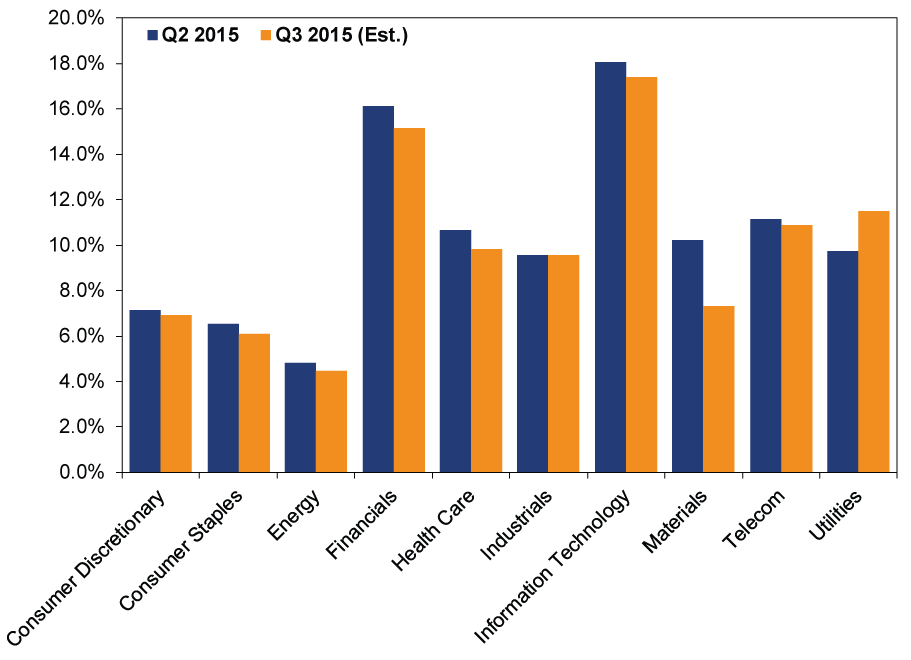
Source: FactSet, as of 10/13/2015. S&P 500 sector-level net income divided by sales, Q2 (actual) and Q3 (consensus estimates) 2015.
Three things jump out at us from these charts. One, Financials and Tech are hugely profitable. Two, excluding Energy, margins are over half a percentage point higher. Three, even if you include Energy, margins are still pretty cushy. Q3's projected margin roughly matches Q1 2014 and Q2 2014, when corporate America was overall in fine shape. If it was good then, we struggle why it would be so darned bad now.
This is even more apparent if you look further back. Exhibit 3 shows S&P 500 net margins since January 1996.
Exhibit 3: 20 Years of S&P 500 Net Profit Margins
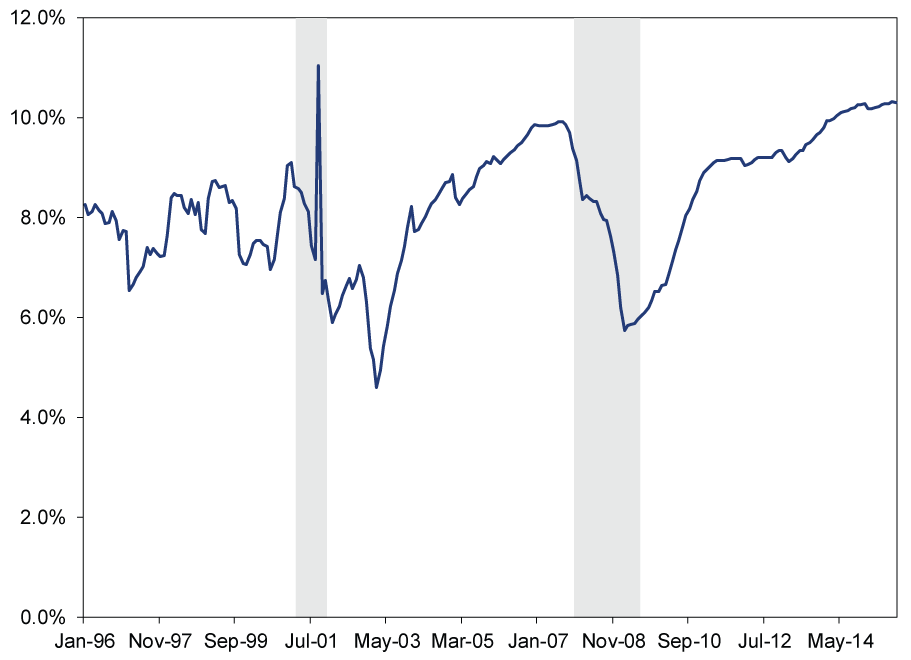
Source: FactSet, as of 10/13/2015. S&P 500 12-month trailing net income divided by S&P 500 12-month trailing sales, monthly, January 1996 - September 2015. Shading indicates US recessions, using business cycle dating from the National Bureau of Economic Research.
If you are wondering what all the fuss is about, trust us, we are right there with you. Margins are about as fat as they've ever been in the last 20 years. Even if they tick down a bit, they'll still be pretty darned big. Nor do falling margins mean a recession is nigh. Yes, margins ticked down before the last two recessions began. But there were also many false reads during the last two bull markets. It is fairly normal for margins to wobble as costs and revenues wiggle. This is just normal volatility, folks.
Also! All these Q3 figures are estimates, based on analysts' expectations for S&P 500 earnings to fall -5.2% y/y for the quarter. They expected similar for Q1 and Q2 and were dead wrong, as earnings rose 0.9% y/y in Q1 and fell just -0.7% y/y in Q2.[iii] Analysts still don't seem to have accounted for the dollar's positive impact on import costs, which raises the likelihood firms shatter expectations once again.[iv] We'll be keen to revisit all this in two months or so, when earnings season is over.
So we take an altogether different view of this from most of the punditry. Outside of the commodity-reliant Energy and Materials sectors, most firms are in pretty great shape. Multinationals might have trouble maintaining revenue growth overseas if the dollar stays strong, but reduced overseas costs should offset most of the impact. The energy-intensive Industrials sector should continue benefiting from cheaper energy and petrochemical feedstock costs. Financials and Tech, home to some of the nation's biggest, most flexible companies, are in the catbird seat.
At some point, economic fundamentals will deteriorate, imperiling profitability and stocks. But we don't think that time is here yet-not with yield curves relatively steep, leading economic indexes in the US and Europe high and rising and loan growth humming along. These are all hallmarks of a healthy expansion. That few see it and interpret healthy margins as a negative shows how far behind sentiment is. There is still a nice, big wall of worry for this bull market to climb.
[i] Or mostly missed it-one article that we found got it right.
[iii] FactSet, as of 10/13/2015.
[iv] We say this because they didn't revise their Q3 and Q4 forecasts up when Q1 and Q2 trounced expectations-expectations based primarily on the strong dollar taking a big bite. For now, they project the pain will still come, just later than they first suspected. It usually takes several quarters for analysts to capitulate and change their models after several quarters of missing.
If you would like to contact the editors responsible for this article, please message MarketMinder directly.
*The content contained in this article represents only the opinions and viewpoints of the Fisher Investments editorial staff.
Get a weekly roundup of our market insights
Sign up for our weekly e-mail newsletter.

You Imagine Your Future. We Help You Get There.
Are you ready to start your journey to a better financial future?

Where Might the Market Go Next?
Confidently tackle the market’s ups and downs with independent research and analysis that tells you where we think stocks are headed—and why.
Related Resources
-
Expert Commentary This Week in Review | Fed Rate Decision, US-Iran, Inflation in Europe
 2026-06-19
 -
Market Analysis Reviewing Q1 Earnings and What Q2 Expectations Say2026-06-18
-
Market Analysis Kevin Warsh and the Magical Delete Button2026-06-17
-
Market Analysis The Politics and Practicalities of the Social Security Trust Fund2026-06-16


Learn More
Learn why 200,000 clients trust us to manage their money and how Fisher Investments and its affiliates may be able to help you achieve your financial goals.
As of 3/31/2026
New to Fisher? Call Us.
Contact Us Today